Broker-Accurate LME Forward Curves: Aluminum, Copper, Zinc
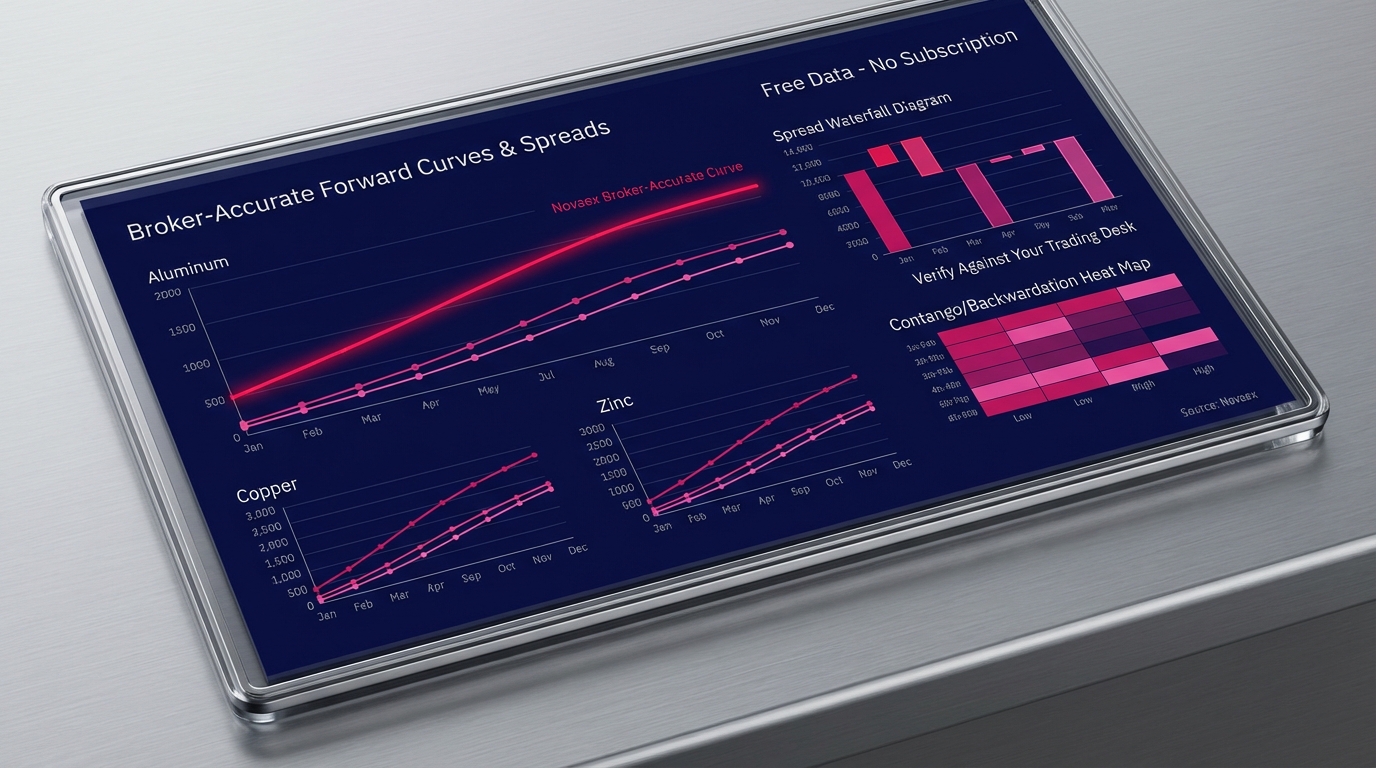
Novaex publishes broker-accurate forward curves for aluminum, copper, and zinc, simultaneously, at no cost. The term structures match what your broker desk produces, from cash through the 3-month benchmark to the outer dated prompts. Take the LME Copper December/March calendar spread visible on the platform and run it against your own desk quotes. The methodology holds.
Forward curve data for base metals has historically been gated behind broker relationships, data vendor subscriptions running tens of thousands of dollars annually, or manual reconstruction from exchange settlement prices. None of those options produce the prompt-date resolution and spread accuracy a hedging desk requires at the moment a position needs to be sized.
This post covers the methodology behind the forward curve publication, the analytical significance of three-metal simultaneous coverage, and how the correlation panel delivers capabilities that single-asset spot feeds cannot replicate. Every claim here is verifiable against live data. That is the verification standard applied throughout.
What "Broker-Accurate" Means in Forward Curve Data
The term carries a precise meaning. A settlement-based forward curve uses exchange closing prices for each listed prompt date administratively determined from ring trading during a specific two-minute window, as documented in the LME's own market data methodology. A broker-accurate forward curve reflects the bid-offer structure that actually clears in the inter-dealer market throughout the session, including interpolated rates between exchange-listed dates and the carry costs brokers price into calendar spread quotes.
These two data types differ fundamentally in substance. According to the LME 2023 Annual Report, total base metals volume across the exchange exceeded 167 million lots. The vast majority of that activity does not occur in the ring during the two-minute settlement window. It occurs continuously across electronic platforms and inter-dealer brokers. Settlement prices capture a snapshot. Broker-accurate curves capture the market.
For a hedging desk executing a rolling aluminum program, the practical implication is direct: a settlement-based curve shows where the market closed. A broker-accurate curve shows where the market is.
What Is a Forward Curve in Metals Trading?
A forward curve plots the price of a commodity at successive future delivery dates, from cash through the full listed tenor of the market. For LME aluminum, that tenor extends to 63 months. For LME copper, it reaches 123 months. For zinc, the standard market convention covers 25 months.
The shape of that curve, whether it is in contango (later dates priced above near-term) or backwardation (near-term at a premium to later dates), encodes the cost of carry and the positioning signal embedded in current market structure. A spot price carries none of that information. A trader managing a 12-month aluminum hedge program who is working from spot prices is operating without the primary data input those decisions require.
The forward curve serves as the base data layer for any multi-tenor hedge program.
Three-Metal Simultaneous Coverage: The Architecture Requirement
Novaex publishes forward curves for aluminum, copper, and zinc in a single analytical environment. That simultaneity is a strict methodological requirement for any platform built to support rigorous base metals analysis.
Aluminum, copper, and zinc collectively represent approximately 78% of total LME traded volume by metal weight, according to the LME 2023 Annual Report. These metals do not trade in isolation from each other. Their price relationships, spread correlations, and inventory cycles interact in ways that require concurrent visibility to analyze with precision.
A platform that covers a single metal, or applies inconsistent methodologies across metals, cannot reveal the cross-metal dynamics that define risk for smelters, fabricators, and traders with multi-metal exposure. The analytical standard requires that all three forward curves be generated by the same methodology, updated on the same cadence, and presented in the same environment.
How Do Traders Use Forward Curve Correlations for Hedging?
Cross-metal correlation data answers a specific operational question: when aluminum moves across a given tenor, how does zinc typically respond across the same term structure? For producers and fabricators with simultaneous exposure to multiple metals, this calculation determines whether a single-metal hedge leaves the book over-exposed to correlated risk.
Correlation coefficients calculated from LME forward curve returns have historically ranged from 0.55 to 0.82 between copper and aluminum across the 3-to-12-month tenor range, according to published research on base metals co-integration by Watkins and McAleer (Applied Financial Economics, 2006). At the lower end of that range, cross-metal hedges provide limited offset. At the upper end, a copper position meaningfully dampens aluminum exposure.
Novaex's correlation panel presents pairwise coefficients across all three metal pairs (aluminum/copper, aluminum/zinc, copper/zinc) calculated from forward curve returns, not spot returns. That distinction matters because forward curve returns capture roll yield and term structure dynamics that spot-to-spot correlation systematically ignores. A single-asset spot feed cannot produce this output. It lacks the architecture to do so.
The Spread Architecture: Calendar and Cross-Metal Relationships
The most operationally significant data point in forward curve analysis is frequently a spread rather than an outright price. Calendar spreads (the differential between two prompt dates on the same metal) and cross-metal spreads at equivalent tenors define the actual cost environment for most industrial hedging programs.
What Is the Difference Between a Calendar Spread and a Forward Curve?
A forward curve is the complete term structure: every prompt date from cash to the outer contract, displaying the full price trajectory across time. A calendar spread is the explicit price differential between two specific prompt dates on that curve. The LME Copper December/March calendar spread, for example, captures the three-month carry cost between those two delivery months, representing what a physical trader or smelter actually pays or receives when rolling a hedge from one prompt to the next.
According to research from the International Commodities Analysis Group, carry costs embedded in LME base metals calendar spreads can account for between 0.5% and 3.2% of total hedging program cost depending on market structure at the time of roll. Across a program hedging several thousand tonnes annually, that range is a substantial budget line item.
Novaex publishes calendar spreads explicitly rather than requiring the user to calculate them from outright prices. That design decision reflects how trading desks actively consume the data.
The LME Zinc cash-to-3-month spread warrants specific attention here. When that spread has traded in sharp backwardation, as occurred during the 2021, 2022 European smelter curtailment period, it signals physical metal scarcity with a precision that outright price data alone cannot replicate. The Novaex zinc forward curve captures term structure shape across the full 25-month listed tenor, including the crossover point where backwardation transitions to contango. That crossover defines the carrying economics at each tenor segment and is visible only in the curve, never in a spot price.
Verifying Broker-Accurate Forward Curves Against Your Trading Desk
The operational test for any forward curve data source is direct: pull the same prompt dates from the published curve and compare them against the quotes your broker desk is showing at the same timestamp. Persistent divergence indicates a methodology problem. Close matching confirms broker-grade accuracy.
The comparison runs cleanly on any date during London market hours. Three test points are recommended for maximum diagnostic value:
- LME Copper Cash-3M spread: the most liquid and most frequently quoted spread in the base metals market; any broker desk quote is immediately comparable
- LME Aluminum 15-month outright: a tenor that reveals interpolation quality directly; most settlement-based curves degrade in accuracy beyond the 12-month horizon as listed contract liquidity thins
- LME Zinc December/March calendar spread: a specific prompt-to-prompt spread quoted in the inter-dealer market daily, with enough broker activity to provide a reliable external reference
These three data points cover different dimensions of curve quality: spread accuracy, interpolation methodology, and near-curve prompt resolution. If they hold against your desk benchmarks, the underlying curve methodology is sound.
How Accurate Are Free Metals Forward Curve Data Sources?
Most freely available commodity data sources publish settlement prices, not forward curves. Settlement prices are single-point-in-time snapshots from a ring close. They do not reflect intraday carry dynamics, bid-offer spreads, or the interpolated rates between listed prompt dates. A source that publishes only settlement prices merely provides a price table with future dates attached.
According to a 2023 industry survey by Sapient Commodities, fewer than 15% of mid-market commodity trading organizations have access to real-time forward curve data with broker-grade accuracy. The remainder rely on settlement-based approximations or manually reconstructed curves assembled from multiple data sources, a workflow that introduces operational risk at exactly the moment markets are moving and decisions cannot wait.
The distinction Novaex draws is strictly architectural. A forward curve requires interpolation methodology, continuous update cadence, and spread-level accuracy across tenors. Settlement prices require none of those things. They are different data products serving entirely distinct analytical purposes.
[LINK: LME base metals settlement price methodology]
[LINK: metals hedging program cost analysis]
Why Forward Curve Depth Defines Hedging Decision Quality
A front-office trader managing a 6-to-18-month aluminum hedge program makes several decisions that require forward curve data as a primary input: which prompt dates to anchor the hedge, how to structure a rolling program across quarterly dates, when the curve's current shape makes early entry or delayed execution more cost-effective relative to the program's reference price.
None of these decisions are adequately supported by spot price data. According to the CME Group's Commodity Hedging Handbook, the cost differential between an optimally structured hedge and a suboptimally structured one can exceed 1.5% of notional value per hedge cycle. For a program managing annual aluminum volumes in the range of 10,000 to 50,000 metric tonnes (common for mid-market fabricators), that cost compounds across every roll.
When Does Forward Curve Shape Matter More Than Spot Price?
Forward curve shape dominates the hedging decision whenever the market is in significant contango or backwardation. In deep contango, a trader who hedges at the 12-month prompt is paying a material premium above cash; a cost that is visible only in the term structure, never in a spot price. In backwardated markets, the same structure creates a potential roll benefit that a spot-focused analysis will miss entirely.
Shape also governs cross-metal exposure analysis. If copper's term structure is in contango while aluminum is in backwardation across the same tenor window, a producer with exposure to both faces a carry cost asymmetry that can only be modeled with both forward curves present simultaneously. This is a common market condition that requires concurrent visibility across both forward curves, the precise capability the three-metal architecture on Novaex is built to deliver.
According to a 2022 McKinsey & Company report on commodity risk management, firms that integrate pricing data with position management in a unified analytical system reduce mark-to-market error by an average of 23% compared to firms running disconnected data feeds into separate workflows. The integration point (where forward curve data marks open positions in real time rather than serving as an external reference requiring manual import) is where the analytical value becomes operational.
[LINK: commodity risk management integration workflows]
[LINK: base metals hedging program structure]
The Correlation Panel: Where Three-Metal Architecture Becomes Analytically Distinct
The correlation panel is the point at which three-metal simultaneous coverage produces output that no single-metal or spot-only platform can replicate. The panel displays pairwise return correlations (aluminum/copper, aluminum/zinc, copper/zinc) calculated from forward curve returns at each tenor segment, not from spot price returns.
The use case is concrete. A fabricator with simultaneous aluminum and copper exposure needs to know how much their aluminum hedge position mitigates or amplifies their copper risk at the current market structure. Answering that question requires cross-metal correlation data calculated from the same forward curve methodology, applied consistently across both metals, at the same prompt dates.
Spot correlation data answers a narrower question. It measures co-movement in a single price point (the cash delivery date) and discards all term structure information in the process. For a fabricator whose copper exposure runs to 9 months and whose aluminum exposure runs to 12 months, spot correlation provides the wrong calculation entirely.
The Novaex correlation panel displays the forward-curve-based pairwise data directly. No secondary calculation is required. The output is the same analysis a quantitative risk function at an institutional trading desk would produce, made accessible without the infrastructure overhead that function typically requires.
The Data Is Verifiable. Run the Comparison.
Broker-accurate forward curves for aluminum, copper, and zinc are published on Novaex simultaneously, accessible without a subscription or a vendor contract.
The verification process is a three-step comparison against your own trading desk benchmarks:
- Pull the LME Copper Cash-3M spread from Novaex during London hours. Compare it to your broker desk quote at the same timestamp. Note the alignment.
- Check the LME Aluminum 15-month outright against the rate your current data vendor or broker shows for the same prompt. This tests interpolation quality beyond the liquid near-curve range.
- Compare the LME Zinc December/March calendar spread against your trading system's reference rate for the same spread on the same date.
If those comparisons hold, you are looking at a forward curve infrastructure that matches what institutional desks rely on, without the vendor relationship, the data subscription cost, or the manual reconstruction workflow.
The analytical standard applied here is a testable proposition. The forward curve data is published. The LME Copper December/March spread is visible. The aluminum and zinc term structures are live. The comparison is yours to make.
For trading desks that need to move beyond that initial verification, into position management, rolling hedge optimization, and multi-metal risk analytics built on the same data layer, the full Novaex platform is the logical next step.
Novaex base metals forward curve platform
[LINK: LME base metals market data overview]
[LINK: metals hedging program benchmarking methodology]