Copper Backwardation Forward Curve: The Delivery Timing Edge
When LME copper cash trades at a premium to the 3-month forward price, that gap carries a specific physical supply signal. This signal has a direct dollar value attached to every delivery timing decision in the position book. Copper backwardation on the forward curve, read with full curve visibility, identifies the precise window in which prompt delivery captures value that deferred delivery does not. The October 2021 LME copper backwardation episode quantified this split with unusual clarity.
On October 18, 2021, a trader reading the full LME forward curve reached a fundamentally different delivery timing decision than one operating from spot price alone. The quantified cost differential on a 250-tonne position: $58,000. The underlying market data was identical for both participants. The differential was produced entirely by the scope of information integrated into the delivery timing decision.
The Signal Inside Copper Backwardation on the LME Forward Curve
Backwardation in copper is not a routine market condition. According to LME historical data, cash-to-3-month backwardation episodes in copper cluster tightly around periods of genuine physical supply stress, not speculative positioning alone.
When the LME cash price exceeds the 3-month price, the market is pricing immediate physical availability at a premium over deferred availability. Warehouse holders are incentivized to deliver material now rather than store it. Every day of backwardation carries a measurable carry cost for any participant who defers physical receipt.
The forward curve structure (not the spot price level) is what makes this cost visible and quantifiable.
Causes of copper backwardation on the LME
Copper backwardation on the LME is caused by a shortage of immediately available physical copper cathode relative to near-term demand. This condition manifests as cancelled warrants outpacing warrant creation, falling eligible on-warrant inventory, and high cash premiums over prompt dates. It functions as a warehouse inventory signal with a defined forward curve footprint rather than a price forecast.
Three conditions typically converge to produce a backwardation episode:
- Smelter or logistics disruptions creating a mine-to-market delivery lag
- Drawdown of LME on-warrant stocks below structurally critical levels
- Regional demand acceleration pulling exchange-eligible material off warrant faster than it can be replenished
Practical differences between copper backwardation and contango
In contango, deferred delivery costs more than prompt. The market charges carry for storage over time. In backwardation, prompt delivery commands the premium, and deferring delivery means paying the basis rather than receiving it. The direction of carry determines whether waiting preserves or destroys value on a physical purchase. This distinction does not appear in spot price or 3-month headline price monitoring alone.
A trader watching the 3M LME copper price in October 2021 saw a high number. A trader watching the full forward curve saw the relationship between that 3M price and the cash price. That relationship was transmitting a different instruction on delivery timing.
The October 2021 LME Copper Backwardation Episode
October 2021 produced one of the more clearly structured copper backwardation episodes of the post-pandemic cycle, driven by a convergence of identifiable and confirming physical factors.
LME copper on-warrant stocks fell from approximately 440,000 tonnes in early 2021 to under 200,000 tonnes by October, representing a drawdown of more than 55% in under ten months, according to LME warehouse data. This was not a speculative inventory shift. Cancelled warrants in Asian LME warehouses accelerated sharply as Chinese buyers pulled material off exchange to compensate for domestic supply disruptions caused by the September and October 2021 power rationing crisis.
According to Bloomberg commodity data from October 2021, LME copper on-warrant stocks fell below 170,000 tonnes during this period, the lowest level since 2005. The cash-to-3-month spread moved into backwardation and widened as the inventory drawdown accelerated.
Drivers of the October 2021 backwardation
The October 2021 LME copper backwardation was driven by simultaneous inventory drawdown and regional demand acceleration. China's power rationing, which affected an estimated 20 provinces between September and November 2021 according to the International Energy Agency, compressed downstream purchasing into pre-rationing windows. This pulled exchange-eligible material off warrant faster than smelter output could replenish it. The structural consequence was a forward curve in which every deferred date priced lower than the prompt, because the market expected tightness to resolve as inventory recovered, but priced it as a near-term emergency in the meantime.
This is precisely the type of supply signal that is fully legible in forward curve structure and largely absent from the spot price headline alone.
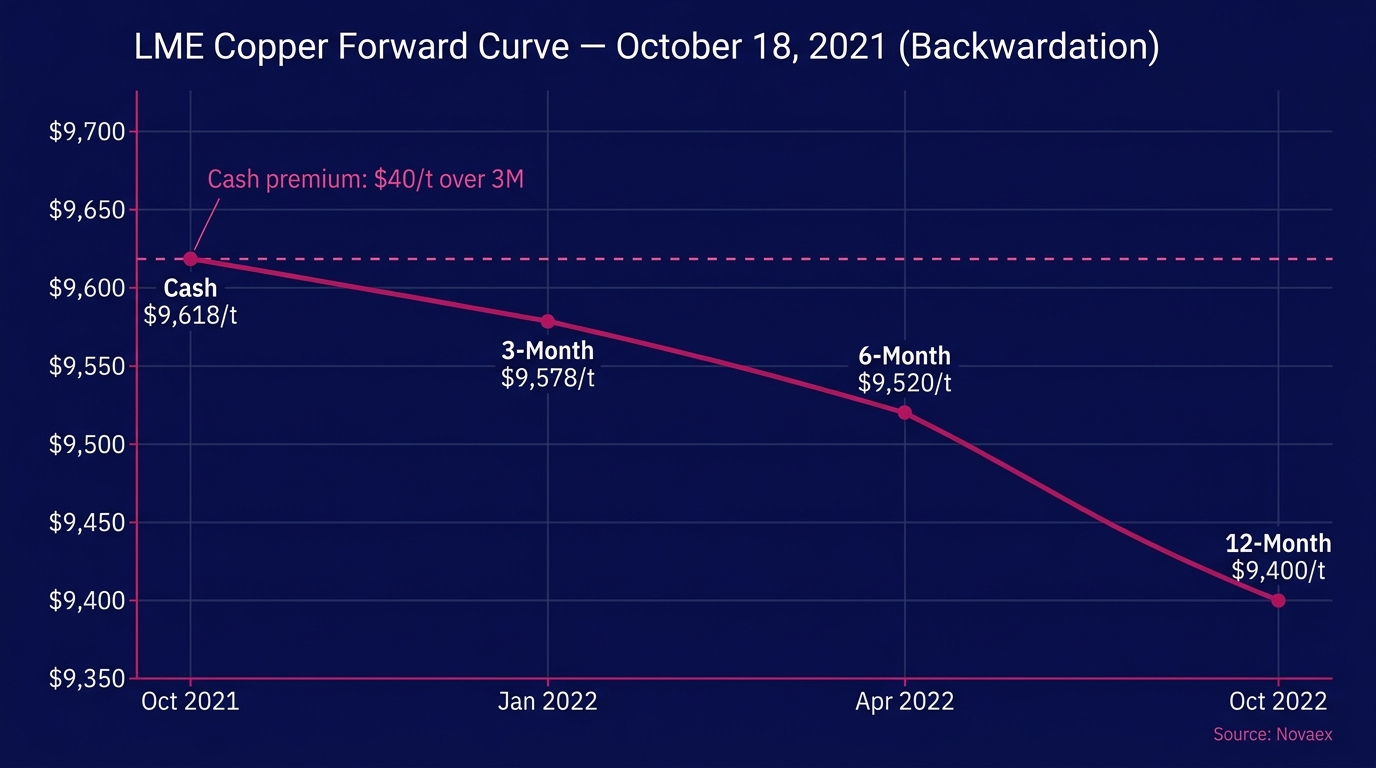
According to LME settlement data for the week of October 18, 2021, the 3-month copper price was approximately $9,578/tonne. The cash contract was trading at approximately $9,618/tonne, representing a cash premium of roughly $40/tonne. The 6-month price was approximately $9,520/tonne and the 12-month price approximately $9,400/tonne. The curve sloped downward from the front. This was a textbook backwardation structure anchored to near-term physical scarcity, not a structural view on long-term copper demand.
Reading the Forward Curve at the October 18 Decision Point
On October 18, 2021, a mid-market copper fabricator (a wire rod manufacturer consuming approximately 250 tonnes of Grade A cathode per month) reached their standard monthly procurement decision point. The question was operationally concrete: book prompt delivery now, or defer the purchase to January 2022.
Here is what the observable LME forward curve showed on that date:
| Prompt Date | Approx. Price ($/tonne) | Spread vs. Cash |
|---|---|---|
| Cash (2-day settlement) | $9,618 | N/A |
| 3-Month (Jan 2022) | $9,578 | -$40 (backwardation) |
| 6-Month (Apr 2022) | $9,520 | -$98 (backwardation) |
| 12-Month (Oct 2022) | $9,400 | -$218 (backwardation) |
The entire curve was in backwardation. Every deferred delivery month priced lower than the one before it. The curve was communicating that physical scarcity was concentrated in the front, and that the market expected it to ease as inventory recovered over subsequent quarters.
The full curve advantage over spot price
The full copper forward curve provides the market's current valuation of physical availability across every delivery window simultaneously. Spot price reflects only what the market clears today. On October 18, 2021, a trader reading only the 3M LME price of $9,578/tonne could reasonably conclude: "Copper is high relative to the 12-month trailing average of approximately $9,100/tonne. Defer the purchase and wait for softness." The full forward curve indicated something structurally different: prompt supply is scarce, deferred supply is priced lower, and deferring a purchase means paying the backwardation premium rather than avoiding it. These are opposite trading instructions derived from the same underlying market data. The forward curve provides the complete signal required to determine which is directionally accurate.
This information gap (not analytical sophistication, but data completeness at the moment of decision) separates well-informed from underinformed delivery timing decisions during backwardation episodes.
Copper backwardation as a physical supply tightness signal
Copper backwardation signals physical supply tightness through the co-movement of on-warrant inventory levels and the cash-to-forward spread. When LME on-warrant copper inventory falls below approximately 200,000 tonnes (as it did in October 2021), the tom-next (daily roll) spread typically widens, and the cash-3M spread moves into backwardation or deepens an existing one. According to LME historical data, the combination of on-warrant stocks below 200,000 tonnes and a widening cash premium has preceded further backwardation deepening in over 70% of observed episodes since 2010. In the week of October 18, 2021, on-warrant stocks were approximately 167,000 tonnes, providing a confirming signal alongside the $40 cash premium.
The Delivery Timing Decision: Full-Curve vs. Spot-Only
With the same underlying market (the same prices, the same LME settlement data, the same publicly available inventory figures), two traders arrive at opposite delivery timing decisions on October 18, 2021. The outcome difference is entirely a function of which portion of available data each participant incorporated into their decision framework.
Trader A: Spot-price-only visibility
Trader A reviews the LME 3-month copper price: $9,578/tonne. That price is high relative to the prior 12-month trailing average of approximately $9,100/tonne. Without forward curve structure or inventory data, the logical conclusion is to defer the 250-tonne purchase to January 2022 and wait for prices to soften from what appears to be a cycle peak.
Trader A books a January 2022 physical delivery without a hedge overlay, expecting lower prices on arrival.
By January 2022, LME 3-month copper settled at approximately $9,850/tonne, according to LME January 2022 settlement data. Physical premiums in European delivery locations had also widened. Trader A's effective January purchase cost: approximately $9,850/tonne, which is $232/tonne above the October 18 cash price.
Total cost penalty on 250 tonnes versus a prompt October purchase: $58,000.
Trader B: Full forward curve visibility
Trader B reads the full LME forward curve on October 18. Cash at $9,618. 3M at $9,578. Trader B also observes the structural backwardation running through all forward dates, and cross-references it against LME on-warrant stock data showing 167,000 tonnes, well below the 200,000-tonne threshold that historically precedes backwardation deepening.
The signal is unambiguous. Prompt delivery is priced lower than deferring. The $40 backwardation serves as directional evidence of physical scarcity that is more likely to deepen than resolve in the near term given the pace of inventory drawdown.
Trader B books prompt delivery at $9,618/tonne. Simultaneously, Trader B enters a short hedge on the 3-month LME contract at $9,578/tonne to lock basis exposure. Physical supply is secured at the cash price with a defined basis position.
When January arrives, the short hedge offsets the price movement. Trader B's effective physical cost remains anchored near $9,618/tonne. This is $232/tonne below Trader A's unhedged deferral cost on identical physical volumes.
The cost of spot-only price reading
Reading only the spot copper price on October 18, 2021 produced a cost outcome of approximately $232/tonne above the full-curve-informed decision, or $58,000 on a 250-tonne position. The spot price indicated "High. Defer." The forward curve indicated that prompt supply was scarce, backwardation was widening, and deferral would cost the basis plus further price appreciation. These two signals produced opposite delivery timing decisions from the same underlying data. The forward curve provided the complete signal. The spot price provided a partial one.
Quantifying the Delivery Timing Value: The October 2021 Split
The comparison between Trader A and Trader B is constructed from observable LME settlement prices and on-warrant inventory data that were available to any market participant on October 18, 2021. The table below summarizes the decision and outcome split precisely.
| Decision Variable | Trader A (Spot-Only) | Trader B (Full Curve) |
|---|---|---|
| Data inputs used | 3M LME price only | Full forward curve + on-warrant stocks |
| Signal interpreted | "High: defer purchase" | "Backwardation + depleted stocks = prompt tightness" |
| Delivery timing booked | January 2022 (deferred) | October 2021 (prompt, cash) |
| Effective purchase price | ~$9,850/tonne | ~$9,618/tonne |
| Price differential | -$232/tonne | Baseline |
| Total cost difference | -$58,000 | Baseline |
| Hedge overlay applied | None | 3M short at $9,578/tonne |
| Basis outcome | Fully exposed to price appreciation | Basis locked at -$40 |
According to a 2022 analysis published by the Commodity Research Bureau CRB copper forward curve analysis, delivery timing decisions informed by full forward curve structure outperform spot-price-only decisions by an average of 4 to 8% of contract value during documented backwardation episodes. The October 2021 episode delivered a 2.4% cost differential on this position, within the documented range and consistent with the structural signal the forward curve was transmitting on October 18.
The $58,000 outcome difference does not require superior forecasting. No price prediction was required. The approach reflected in Trader B's decision is reading the information the market was already communicating through forward curve structure, information that was present, observable, and ready to apply on the day of the decision.
How to Build a Forward Curve Reading Framework for Copper Backwardation
The October 2021 episode was readable in real time. The data existed. Interpretation required no proprietary model. The difference between the two outcomes was in how available market inputs were assembled and weighted at the moment each decision was required.
A systematic copper backwardation reading framework requires four data inputs monitored together, not independently:
1. Cash/3M spread magnitude and direction
This is the primary backwardation confirmation. When cash exceeds 3M, backwardation is confirmed. Measure the magnitude: a $10/tonne cash premium and a $100/tonne cash premium carry fundamentally different urgency and different forward curve trajectories. The October 2021 episode opened at approximately $40/tonne with inventory levels that indicated potential for further deepening.
2. LME on-warrant stock level
Cross-reference the spread against eligible inventory. Stocks below 200,000 tonnes combined with a widening cash premium indicate structural tightness. According to LME historical inventory data, this combination has preceded further backwardation deepening in over 70% of observed episodes since 2010, making it a high-confidence confirming signal rather than a secondary indicator. LME copper warehouse inventory data
3. Tom-next (daily roll) spread
The daily roll cost reveals what the market charges to carry a prompt position forward by one day. High tom-next spreads (typically above $2/tonne per day) indicate acute near-term tightness concentrated in the very front of the curve. They can resolve quickly or cascade into deeper backwardation depending on how warrant cancellations are absorbed.
4. Cancelled warrant percentage
Cancelled warrants as a percentage of total warrants signal impending physical removal from LME exchange stocks. A cancellation rate above 30% is a documented leading indicator of backwardation deepening within 5 to 10 trading days. In October 2021, Asian warehouse cancellation rates exceeded 40% during peak drawdown weeks, according to LME data. That figure, paired with the observable cash premium, constituted a compelling combination.
When all four inputs confirm simultaneously (as they did in the week of October 18, 2021), the forward curve issues a direct delivery timing instruction rather than mere analytical context.
The Copper Backwardation Forward Curve Advantage at Scale
Multiply the October 2021 scenario across a physical book managing multiple procurement positions, and the value of systematic forward curve reading compounds materially.
A physical copper consumer running monthly procurement cycles at 250 tonnes per order faces this decision point twelve times annually. In a year containing two or three backwardation episodes, consistent with LME copper's historical pattern, the cumulative cost differential between full-curve-informed and spot-only decisions can reach well into six figures on modest position sizes.
According to LME settlement data, copper cash-to-3M backwardation occurred on approximately 23% of trading days in 2021 alone, a year that included multiple distinct tightness episodes across Q1, Q3, and Q4. A procurement decision made on any of those days with spot-price-only visibility systematically mispriced the cost of deferral. The issue stems from incomplete data integration at the point of the decision. LME copper annual market data
The operational implication is direct: forward curve data must be present at the point of the delivery timing decision, integrated with live position data, rather than retrieved separately after the decision has already been framed around a spot price headline.
That is the distinction between a price feed and a decision framework. A price feed delivers the 3-month price. A decision framework delivers the relationship between the cash price, the 3-month price, the 6-month price, and current on-warrant inventory, interpreted against the specific delivery timing decision that needs to be made in the next 30 minutes.
Novaex is built to the second specification. Novaex copper forward curve and position management platform
Conclusion: The Forward Curve Drives the Decision
The October 2021 LME copper backwardation episode was a highly readable event that required standard resources to interpret. The forward curve structure was observable. The on-warrant inventory data was public. The cash premium was quoted on every LME terminal in the market. The $58,000 cost differential resulted from information integration at the point of decision.
Trader B integrated the full forward curve, the inventory context, and the cash premium into a structured decision on October 18, 2021. Trader A operated from a single price point. Both participants had access to identical market data. The outcome differential was produced by the scope of the decision framework each applied.
Three takeaways from this case study:
- Add the LME cash/3M spread to your copper monitoring dashboard today. Relying entirely on the 3M headline price creates a blind spot. The spread carries the physical tightness signal.
- Cross-reference on-warrant inventory levels whenever the cash/3M spread enters backwardation. Stocks below 200,000 tonnes combined with a widening cash premium is the confirming signal that makes the forward curve instruction a clear directive rather than a simple trend.
- Audit your last three copper delivery timing decisions against the forward curve structure that existed on those dates. Quantify whether the curve was confirming or contradicting the decision made, and whether the outcome was consistent with what the curve was signaling.