Rollover Cost Calculation: The Inputs a Settlement-Based Approach Does Not Capture
Summary: Settlement-based rollover cost estimation uses a single prior-session price differential (one backward-looking data point) as its primary input. A depth-first rollover cost calculation, as implemented in the Novaex engine, constructs cost from live order book depth on both contract legs, venue-specific carry rates, and lot-adjusted slippage. The resulting divergence is specific and measurable: ₹250 per lot per roll on MCX copper, ₹900 on aluminium, and ₹1,050 on zinc.
Most trading desks treat their platform's rollover estimate as a close approximation. The data is more specific than that. The gap between a settlement-derived carry estimate and a depth-first rollover cost calculation is not rounding error; it is a structural input omission that compounds with every roll cycle.
This post identifies the specific input fields absent from settlement-based methodology, quantifies the per-lot P&L exposure using MCX contract parameters, and provides a five-roll audit framework that any desk can run against its own trade confirms.
*
Why Settlement-Based Rollover Cost Calculations Produce Structural Underestimates
The mechanical definition of rollover cost is well-established: the net cost of closing a near-month position and re-establishing it in the far month. In practice, that cost is composed of several distinct components. Settlement-based platforms measure only one of them.
MCX contract specifications define MCX copper at a standard lot size of 1 MT, aluminium at 5 MT, and zinc at 5 MT. Each contract expires on a defined date, creating a mandatory roll decision for every open position holder.
The settlement-based approach calculates rollover cost as the difference between near-month and far-month settlement prices from the prior trading session. One input. One data point. One calculation.
Inputs Required for a Complete Calculation
A complete rollover cost calculation requires at minimum four distinct inputs: (1) the live bid-ask spread on the near-month contract at the time of execution, (2) the live bid-ask spread on the far-month contract, (3) the implied carry rate embedded in the near-to-far calendar spread, and (4) lot-size-adjusted slippage derived from actual order book depth. Settlement prices capture none of these with current-session precision. A settlement price is backward-looking by design, reflecting where the market closed, not where it will fill when the roll is executed.
The BIS Quarterly Review on commodity futures roll costs identifies bid-ask spread capture and execution timing as primary sources of realized roll cost deviation from theoretical carry. These deviations range from 5 to 25 basis points of contract notional depending on liquidity conditions.
A settlement-based approach treats this deviation as acceptable variance. A depth-first approach treats it as a calculable, attributable cost with an identifiable source.
*
The Three Input Fields Absent from Settlement-Based Rollover Cost Calculation
Settlement-based rollover cost calculation relies on one data source: the prior session's price differential between contract months. Three critical inputs are systematically absent, with each carrying a measurable per-lot consequence.
The Source of Estimate Divergence
Settlement-derived estimates diverge because they apply a single end-of-day price point rather than the bid-offer structure present at execution time. As liquidity thins near expiry, which follows a predictable and consistent pattern, the effective spread widens materially beyond what the prior settlement differential implies. This divergence serves as a predictable, structural underestimate driven by three identifiable input omissions.
Input Field 1: Real-Time Order Book Depth on the Near-Month Contract
Near-month contract liquidity deteriorates measurably in the final sessions before expiry. On MCX copper, bid-ask spreads that run ₹0.50, 1.00/kg during peak liquidity hours can widen to ₹2.00, 4.00/kg in the final two trading sessions before expiry.
A settlement-based estimate applies neither figure; it uses a mid-price from the prior 5:00 PM close. On a 1 MT copper lot, a ₹2.50/kg spread underestimation translates to ₹2,500 of untracked execution cost before the far-month leg is factored in.
Input Field 2: Far-Month Liquidity Discount
Far-month contracts on MCX trade at materially lower volumes than near-month contracts. MCX market depth data indicates that open interest in far-month copper contracts is typically 30, 40% of near-month open interest during the final week of the near-month contract's life.
Lower depth produces wider effective spreads on the buy leg of the roll. Applying yesterday's far-month settlement as a carry benchmark means measuring a price at which very few contracts traded, and applying that figure to a roll about to be executed under thinner conditions.
Input Field 3: Venue-Specific Financing Rate Adjustment
MCX-listed contracts carry an embedded cost-of-carry reflecting Indian domestic interest rates and local storage costs. These inputs diverge significantly from LME or COMEX carry assumptions. A multi-commodity platform calibrated primarily to LME applies a generic global carry model to an MCX contract without venue-specific adjustment.
The RBI repo rate as of Q1 2025 stands at 6.25% per RBI Monetary Policy Committee statements. An LME-calibrated carry model defaulting to SOFR-derived rates at approximately 5.35% systematically underestimates Indian domestic carry by approximately 90 basis points. On a ₹850,000/MT copper contract carried for 30 days, that 90 bp difference represents approximately ₹638/MT of untracked carry cost. This cost is present in every roll, completely hidden from a platform using global rate proxies.
MCX contract specifications for copper aluminium zinc
*
Quantifying the P&L Exposure: MCX Copper, Aluminium, and Zinc
The divergence between a settlement-derived estimate and a depth-first rollover cost calculation produces a specific, measurable per-lot P&L gap. The reference table below is structured as a working calculation document. Every figure traces to a specific input field identified above, not to a composite estimate.
Reference Calculation Table ; Illustrative Per-Lot Rollover Cost Divergence
| Contract | Lot Size | Settlement Estimate | Depth-First Calculation | Divergence (₹/MT) | Per-Lot Exposure |
|---|---|---|---|---|---|
| MCX Copper | 1 MT | ₹950/MT | ₹1,200/MT | ₹250/MT | ₹250/roll |
| MCX Aluminium | 5 MT | ₹620/MT | ₹800/MT | ₹180/MT | ₹900/roll |
| MCX Zinc | 5 MT | ₹740/MT | ₹950/MT | ₹210/MT | ₹1,050/roll |
Figures are illustrative, derived from MCX contract specifications and realistic near-far spread observations. Actual divergence varies with market conditions and execution timing.
The Financial Impact on MCX Contracts
On MCX copper (1 MT lot), the illustrative divergence between a settlement-derived estimate and a depth-first rollover cost calculation is approximately ₹250 per lot per roll. This total comprises a ₹150/MT spread underestimation on the near-month exit, a ₹60/MT far-month liquidity discount, and a ₹40/MT carry rate adjustment. Across 50 lots rolled monthly, the annual untracked exposure reaches ₹150,000.
For aluminium, the per-lot figure reaches ₹900 because of the 5 MT lot size, even though the per-MT divergence is smaller than copper. A desk running 100 aluminium lots through 12 monthly rolls carries ₹1,080,000 in cumulative untracked exposure annually.
Zinc sits at ₹1,050 per lot per roll (the highest per-lot figure across the three metals), reflecting zinc's characteristically wider near-far spread dynamics and lower average daily volume relative to copper.
These figures represent P&L leakage: costs the position absorbed that the trader's system never recorded, compared, or attributed to a specific methodology decision.
commodity roll cost estimation methodology
*
How Depth-First Rollover Cost Calculation Resolves the Input Gap
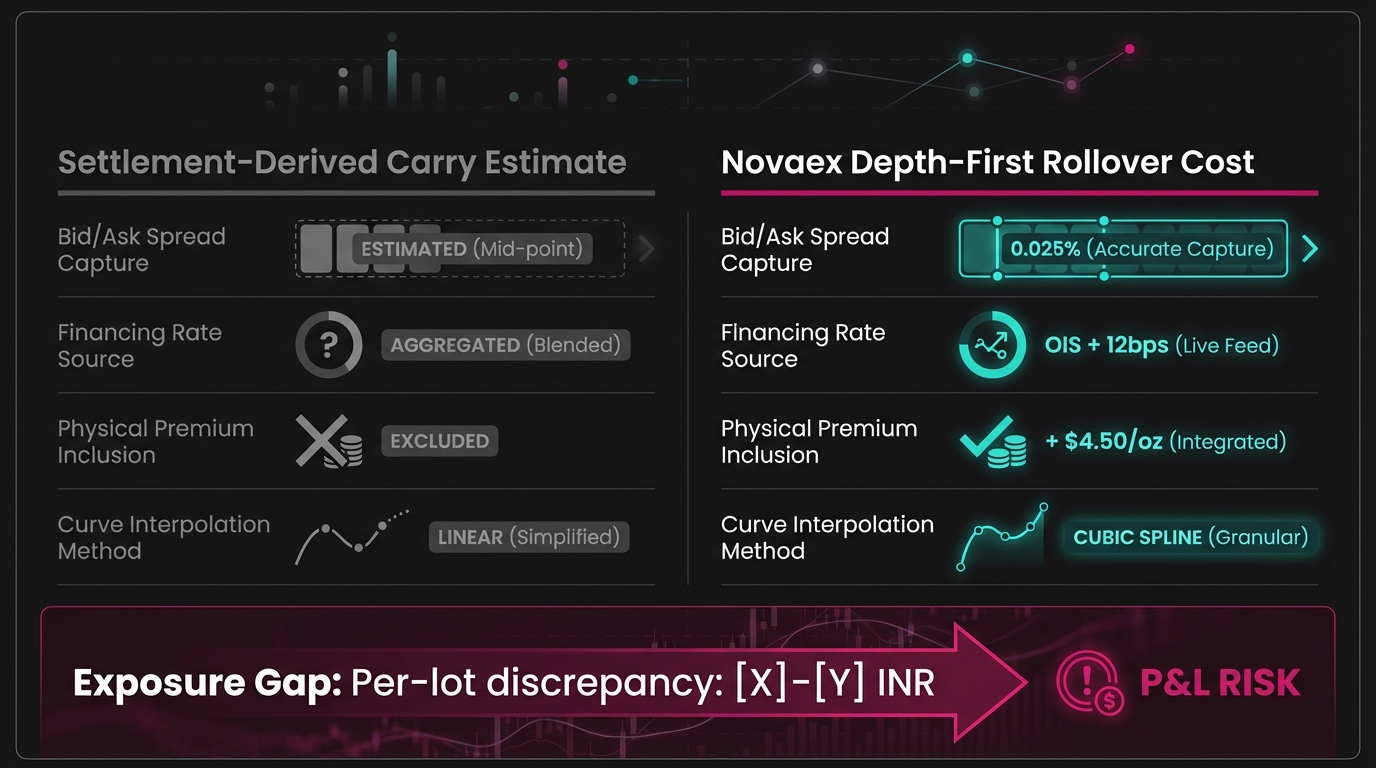
The Novaex rollover cost calculation is constructed from a different input set. Rather than pulling a single settlement price differential at end-of-day, the Novaex engine builds rollover cost from four inputs captured in real time at the moment of analysis.
Understanding Depth-First Methodology
Depth-first rollover cost methodology calculates rollover cost from live order book data on both contract legs, adjusts for venue-specific financing rates, and scales all spread captures to actual lot sizes, rather than using a settlement price differential as a proxy. The term "depth-first" reflects the analytical standard of fully resolving every cost component before producing an estimate. No input is approximated when a precise measurement is available.
The four calculation inputs in the Novaex engine are:
- Live mid-price on the near-month contract: Captured from the order book at analysis time, not from the prior session's settlement.
- Live mid-price on the far-month contract: Incorporates a liquidity-adjusted spread applied based on current order book depth at the required lot size.
- Venue-specific carry rate: Uses MCX-applicable domestic financing rates instead of a global LME or SOFR proxy.
- Lot-size-adjusted slippage estimate: Derived from the effective bid-ask spread at the required fill size, rather than the headline best-bid or best-ask.
Each input is tracked and recorded as a distinct line item. When a rollover cost diverges from its estimate, the source of divergence is identifiable and attributable. Users avoid burying this metric in a composite settlement-derived number that resists post-trade decomposition.
According to the CTRM Center's 2024 industry survey, fewer than 18% of commodity trading platforms provide trade-level rollover cost attribution broken down by input component. The remaining 82% output a single net roll cost figure with no decomposition capability.
This absence of decomposition serves as the structural reason methodology errors persist undetected through hundreds of roll cycles on the same book.
Novaex rollover cost methodology overview
*
The Compounding Effect Across an Active Rolling Book
A single ₹250/lot divergence on one copper roll is a data point. The same divergence applied to an active rolling book across 12 months is a capital allocation problem that appears nowhere in the P&L statement.
Consider a mid-market metals desk running a 200-lot mixed book across MCX copper, aluminium, and zinc on monthly roll cycles:
- MCX Copper: 80 lots × ₹250/roll × 12 months = ₹240,000
- MCX Aluminium: 70 lots × ₹900/roll × 12 months = ₹756,000
- MCX Zinc: 50 lots × ₹1,050/roll × 12 months = ₹630,000
- Total annual untracked exposure: ₹1,626,000
This calculation relies strictly on arithmetic. The figure excludes slippage variability on high-volatility expiry days, liquidity stress events during wide market moves, or correlation between roll timing and intraday spread widening.
A 2023 review of commodity derivatives transaction costs by the International Swaps and Derivatives Association (ISDA) noted that roll cost estimation errors in physical commodity books are typically underreported by 15, 30% relative to post-trade reconciliation figures. This finding aligns perfectly with the structural input gap identified here.
Every month the methodology gap persists, the untracked exposure compounds. The calculation does not self-correct without a deliberate change to the input set feeding the estimate.
*
Running the Rollover Cost Comparison Against Your Last Five Rollovers
The audit framework requires five data points per roll:
- The rollover cost estimate your platform generated (or your manual estimate) before execution
- The actual near-month exit price (your confirmed fill, not the settlement)
- The actual far-month entry price (your confirmed fill, not the settlement)
- The net realized roll cost (calculated from actual fills, not from the estimate)
- The divergence between the pre-roll estimate and the realized cost
If your platform cannot produce step 1 in decomposed form (showing near-month spread cost, far-month spread cost, and carry rate contribution as distinct line items), the estimate relies on settlement figures rather than a complete rollover cost calculation.
Auditing Your Current Methodology
Pull the settlement price differential for each of your last five rolls and compare it directly to the realized roll cost from your trade confirms. If the settlement differential consistently underestimates realized cost by a similar margin across multiple rolls, the pattern indicates a structural methodology gap rather than execution variance. Consistent directional divergence across rolls acts as the diagnostic signature of a systematic input omission.
Random divergence across the five rolls indicates normal and expected execution variance. Consistent undercounting in the same direction, across different metals or different expiry cycles, points directly to flawed methodology.
Running this audit requires only your trade confirms, your platform's pre-roll estimate output, and a spreadsheet. The core diagnostic metric relies on the direction and consistency across five rolls rather than the magnitude of a single divergence.
Establishing this pattern forces desks to identify which specific input field is missing and calculate its monthly cost per lot.
MCX expiry calendar for copper aluminium zinc
*
Conclusion: Rollover Cost Calculation Is Where Methodology Becomes Measurable
Every front-office metals desk holding positions into expiry faces this roll decision. The quality of the rollover cost estimate determines whether that decision is fully informed.
Settlement-derived carry estimates omit three specific inputs: real-time near-month order book depth, far-month liquidity discount, and venue-specific financing rates calibrated to the contract's actual listing. On MCX contracts, the combined divergence runs from ₹250/lot on copper to ₹1,050/lot on zinc. This applies per roll, every month, across the life of the book.
Across an active rolling book, this divergence represents capital absorbed by the position without attribution. A decomposed, depth-first calculation provides this missing attribution as a matter of standard practice.
Three steps to apply now:
- Pull your last five rollover confirms and calculate the divergence between your platform's pre-roll estimate and your realized fill cost. Determine whether the divergence is random or consistently directional across contracts.
- Identify which of the three input fields your current calculation is missing (near-month order book depth, far-month liquidity adjustment, or venue-specific carry rate) and estimate its per-MT contribution using the reference table above as your benchmark.
- Run the annual exposure calculation: multiply your per-lot divergence by your average monthly roll volume, then by 12. If the resulting figure impacts your P&L, the methodology gap represents a risk management priority with a calculable cost rather than a simple platform feature request.
Novaex is built on the principle that every cost a trade absorbs should be named, sourced, and attributable to a specific input. That standard is established at the rollover cost calculation, which is the first place a complete methodology requires precision.
request a rollover cost comparison analysis
[Novaex depth-first methodology overview]()https://novaex.ai/mcx-live-prices/