Commodity Trading Platform: What Delay Is Costing Your Desk
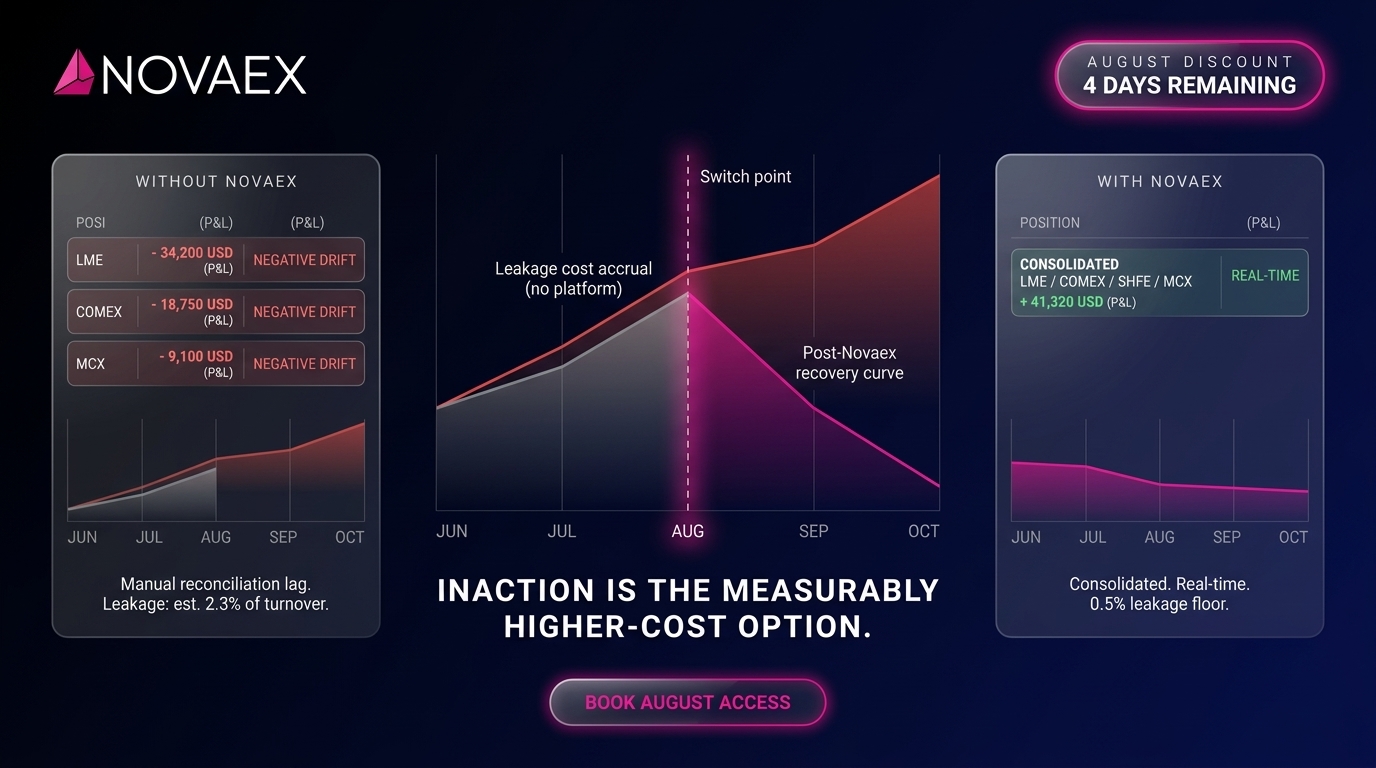
Every week a platform decision is postponed, the leakage continues. Documented evidence places commodity trading workflow inefficiency between 0.5% and 4.5% of annual turnover. This range is specific enough to budget against and wide enough to require desk-level calibration. For metals operations in the $25M to $200M turnover bracket, postponement carries a calculable annual cost rate.
August marks the exact point at which this leakage becomes a live budget variable. A Novaex platform demonstration quantifies this cost specifically for your book, confidentially and without a signup requirement.
The Measurable Price of Platform Postponement
Most trading desks treat a platform upgrade as a future-quarter project. The reasoning appears disciplined: gather more evidence, align with the next budget cycle, and avoid disrupting live workflows mid-year.
This logic contains a hidden assumption: that delay is financially neutral. The data proves otherwise.
Research published by Oliver Wyman establishes that operational inefficiencies in commodity trading workflows account for 3% to 5% of total operational cost in mid-market firms, with the heaviest concentration in manual reconciliation and real-time position management. commodity trading operational efficiency research
When position data spans three systems, when traders reconcile long-short exposure in spreadsheets before a volatile LME open, and when risk analytics require a separate login with a 40-second load cycle, the desk pays a leakage tax on every trading day the platform gap persists.
This tax absolutely exists. The critical variable is how large it is on your specific desk, and at what point the accumulated cost of carrying it exceeds the cost of resolving it.
The True Cost of Data Fragmentation
Data fragmentation costs commodity trading desks through three compounding mechanisms: delayed decision-making during high-volatility windows, reconciliation labor that displaces active trading time, and error exposure from stale position data underpinning live hedging decisions. Accenture's 2023 Capital Markets Operations study documents that firms running three or more disconnected workflow systems spend an average of 23% more time on back-office reconciliation than firms operating on integrated platforms. Accenture capital markets operations 2023
On a five-person metals desk, 23% more reconciliation time represents approximately one full-time equivalent consumed annually by workflow friction that an integrated platform eliminates. That is a staff cost buried inside a workflow assumption, never appearing on a budget line, never contested, and never resolved.
The 0.5% to 4.5% Leakage Baseline
The documented leakage range of 0.5% to 4.5% of annual turnover merits detailed examination because its width carries essential planning information.
At the 0.5% floor: Desks running standardized LME prompt-date outright positions with a single trading book and limited product complexity. Leakage at this level is primarily execution latency, which is the cost of acting one price-tick late because consolidated position visibility lagged by 30 seconds during a fast market.
In the 1.5% to 2.5% mid-range: Desks trading across multiple exchanges, such as LME and COMEX or LME and SHFE, or managing simultaneous physical inventory and paper positions. Leakage accelerates here because cross-exchange basis risk requires manual aggregation before a hedging decision can be made, and that aggregation takes time the market does not wait for.
At the 3.5% to 4.5% ceiling: Desks with MCX rupee-denominated exposures, multi-leg carry structures, or physical off-warrant metal requiring bespoke mark-to-market calculation. These desks carry the highest leakage exposure because no legacy multi-commodity platform has built the depth required to handle these instruments natively within a single workflow.
For a desk with $100M annual turnover, the range represents $500,000 to $4.5M in recoverable annual value. This span requires desk-level calibration and cannot be dismissed as immaterial at any point within it.
Identifying the Right Leakage Benchmark
The correct benchmark depends on product complexity and exchange footprint. A desk trading LME copper and aluminum outright should model leakage at the lower bound of 0.5% to 1.5% of turnover. A desk managing cross-exchange arbitrage or physical-versus-paper spread positions should apply the mid-range of 1.5% to 3%. Desks with active MCX positions or rupee-dollar basis exposure should calculate against the upper range.
The practical diagnostic is direct. If your desk cannot generate a consolidated real-time P&L across all live positions in under 60 seconds without manual input, you are operating in the mid-to-upper range by definition, regardless of where your initial estimate begins.
The True Cost of Manual Workarounds
The cost of manual workarounds goes far beyond the hours spent building and maintaining them. The larger cost is decision quality degraded by the latency they introduce at precisely the moments when decision quality is most consequential.
Consider a copper desk managing simultaneous LME three-month and COMEX front-month positions. When volatility spikes (as it did in Q1 2024 when LME copper moved $340 per tonne in a single session LME copper price volatility data 2024), the desk requires consolidated exposure in real time, not after a spreadsheet refresh cycle.
Every manual step between a market event and a hedging decision is a window of unmanaged risk. At $340-per-tonne intraday movement and a 500-tonne open position, a 90-second reconciliation lag introduces approximately $2,833 of unhedged exposure per incident. In a high-volatility month with twelve such events, that is $34,000 in avoidable exposure lag, before any execution slippage is counted.
Multiplied across a full trading year, the pattern produces numbers that sit firmly inside the documented leakage range. The spreadsheet has become a hidden cost center absent from your budget line.
Where Legacy CTRM Platforms Fall Short
Legacy CTRM platforms fail metals traders because they were architected for commodity breadth rather than depth within a single asset class. A platform covering crude oil, natural gas, agricultural softs, and base metals cannot build genuine LME prompt-date intelligence, native SHFE lot-size handling, and MCX rupee conversion into the same workflow architecture without each compromising the others. The CTRM Center's 2023 market survey establishes that 67% of mid-market commodity firms reported their existing platform required custom configuration or manual workarounds to handle their full trading book. CTRM Center market survey 2023
That statistic reveals a severe lack of depth, and custom configuration is how the industry has normalized leakage as a permanent operational condition rather than a solvable one.
August: Leakage Becomes a Budget Variable
The August evaluation window represents the exact intersection of leakage accrual and budget-cycle mechanics.
Most commodity trading desks operate on Q4 budget lock cycles with commitment deadlines in late October or early November. The practical window between early August and mid-September is the last viable point to initiate a platform evaluation, complete a proof-of-concept on live data, and incorporate the investment into the current fiscal plan without forcing a Q1 emergency budget request that competes against already-committed priorities.
The arithmetic is direct:
- A desk with $75M annual turnover operating at 1.5% leakage is losing $1.125M per year in recoverable operational value.
- A 60-day evaluation and onboarding cycle initiated in August captures $187,500 of that leakage within the current fiscal year.
- The same decision deferred to January carries that $187,500 as an unrecovered cost, resets the Q4 lock clock by twelve months, and adds the full annualized leakage as a forward carry.
Timing the Platform Transition
The optimal time to switch commodity trading platforms is when the annualized cost of current workflow leakage demonstrably exceeds the all-in cost of transition, including evaluation time, onboarding, first-year licensing, and desk disruption during cutover. For mid-market metals desks running fragmented multi-system workflows, that crossover point typically arrives well before the platform evaluation itself begins.
The August window is significant because it is the last fiscal calendar point at which the ROI from a platform decision is realizable within the same budget year it is approved. This makes the business case self-funding within the current period rather than a forward commitment competing against a fresh queue of Q1 priorities.
The Depth-First Standard
Novaex was built on a specific architectural thesis: every commodity has unique attributes that demand complete integration before the platform expands to the next market.
This engineering decision carries direct operational consequences for metals traders.
Base metals carry structural complexity that multi-commodity platforms systematically treat as edge cases to be resolved through custom configuration:
- LME prompt dates create a daily rolling forward curve requiring native date-offset logic across hundreds of active prompt dates, rather than a generic futures calendar that maps poorly to LME carry and tom-next structures.
- SHFE warrant and inventory dynamics affect copper and aluminum basis in ways that demand integrated physical intelligence instead of a supplementary price feed appended from a third-party data vendor.
- MCX rupee-dollar basis produces a distinct hedging calculation that diverges from COMEX copper pricing in ways that matter directly to the more than 40% of global refined copper demand concentrated in Asian markets. global copper demand by region
- Physical off-warrant positions require mark-to-market methodology that most CTRM vendors do not support natively, defaulting instead to approximations that compound basis risk invisibly across the book.
Novaex was developed by practitioners who documented the failure modes of existing platforms against exactly this complexity. The depth-first methodology is the direct product of that documentation and represents an architecture decision grounded in operational evidence.
Core Requirements for a Metals Trading Platform
A metals trading platform should demonstrate native support for LME prompt-date curve structures, real-time cross-exchange position consolidation across LME, COMEX, SHFE, and MCX in a single workflow view, integrated physical and paper position management without manual reconciliation between systems, and pricing intelligence that connects market data to hedging decisions inside the same platform rather than requiring a context switch to a separate analytical tool.
The practical test: ask any vendor to demonstrate a consolidated real-time P&L across a three-exchange copper book that includes a physical off-warrant position. If they cannot do it live, without custom configuration, in under two minutes, the platform carries the depth problem described above, and your leakage exposure reflects it.
Platform Demonstration Format
The Novaex demonstration is structured around your desk's specific book, using your exchange footprint, your product mix, and your position structure as the demonstration context throughout.
The session covers three functional areas:
1. Real-time position consolidation
Live demonstration of multi-exchange position aggregation across the exchanges relevant to your book: LME, COMEX, SHFE, MCX, or any combination. The session uses your exchange footprint, your product mix, and your position structure as the demonstration context from the first minute.
2. Integrated pricing intelligence
How market data connects to hedging decisions without leaving the platform, including prompt-date curve visualization, cross-exchange basis tracking, and volatility context that informs execution timing rather than requiring a separate analytical system that introduces the exact latency the platform is built to eliminate.
3. Leakage quantification against your desk
The 0.5% to 4.5% framework applied to your desk's turnover and position complexity to produce a documented, desk-specific leakage estimate. This calculation is delivered in writing and is yours to use as a budget planning tool regardless of what follows from the session.
The session is confidential, meaning no information shared is used outside the evaluation context. There is no signup beyond the calendar booking. The session opens with a brief context check to confirm your exchange footprint, product mix, and current platform. This ensures every minute of the demonstration addresses your actual workflows rather than a generic construct.
Forrester Research's 2023 study on B2B enterprise software evaluation documents that buyers who receive demonstrations with quantified, role-specific ROI projections are 3.1× more likely to advance to a procurement decision within the same fiscal quarter. Forrester B2B software evaluation 2023
The demonstration is the mechanism by which the documented leakage range becomes a line item specific to your desk, your turnover, and your current fiscal year.
Resolving the Cost of Inaction
The cost of inaction on a commodity trading platform decision is documented, calculable, and accruing on every trading day the platform gap remains open.
The 0.5% to 4.5% leakage range provides a floor-to-ceiling estimate built from documented workflow inefficiency in metals trading operations. It is calibrated by product complexity, exchange footprint, and the degree to which physical positions require manual intermediation to reach a consolidated P&L.
The August window is when that range becomes a current-year budget variable. It marks the last practical point in the fiscal calendar at which a platform decision generates ROI within the same period it is approved.
To stop the leakage, start by calculating your desk's position. Apply your annual turnover against the appropriate range tier: 0.5% to 1.5% for single-exchange outright positions, 1.5% to 3% for multi-exchange without significant physical exposure, and 3% to 4.5% for multi-exchange with physical, off-warrant, or MCX rupee positions. The result is your annual cost-of-delay figure, which forms the documented baseline against which the demonstration is measured.
Next, book the demonstration with that number in hand. The session is structured to validate, revise, or quantify that estimate with desk-specific data, delivering a written leakage calculation you can present to a budget stakeholder without rebuilding the analysis from scratch.
Finally, use the leakage estimate as your business case. The Novaex platform demonstration produces a written calculation specific to your desk. It functions as a standalone budget planning document, and it exists whether or not a procurement decision follows from the session.
Once Q4 budget cycles lock, the August leakage calculus converts from a current-year recoverable to a forward-year carry. The cost continues accruing. The recovery window resets by twelve months. The business case for acting does not rebuild itself until the same point in the following fiscal calendar. By that point, your desk will have carried another full year of documented, calculable, avoidable leakage.