Daily Price Sheet: 9 Metals Trading Workflows Replaced
A metals trading daily price sheet workflow consists of nine discrete manual tasks, from exchange settlement price collection to team distribution, each with a defined input, trigger, and output. This document maps each task to its exact platform replacement function. Each replacement maps to a single manual task; no composite replacements and no process redesign are introduced. The operational complexity being replaced is real, and the replacement structure simplifies it.
The cost of running this workflow manually is measured in the window between market movement and confirmed position visibility. This window widens every time a data entry step, a formula reference, or a file lookup introduces latency into an otherwise real-time problem.
According to research by Dr. Raymond Panko at the University of Hawaii, 88% of spreadsheets in professional use contain material errors. A metals trading price sheet shares this vulnerability. A single transposed settlement figure propagates through every P&L cell, every exposure calculation, and every risk threshold check built on top of it. spreadsheet error rates in financial operations
The nine mappings below define exactly what each manual step does, what replaces it, and what the replacement produces.
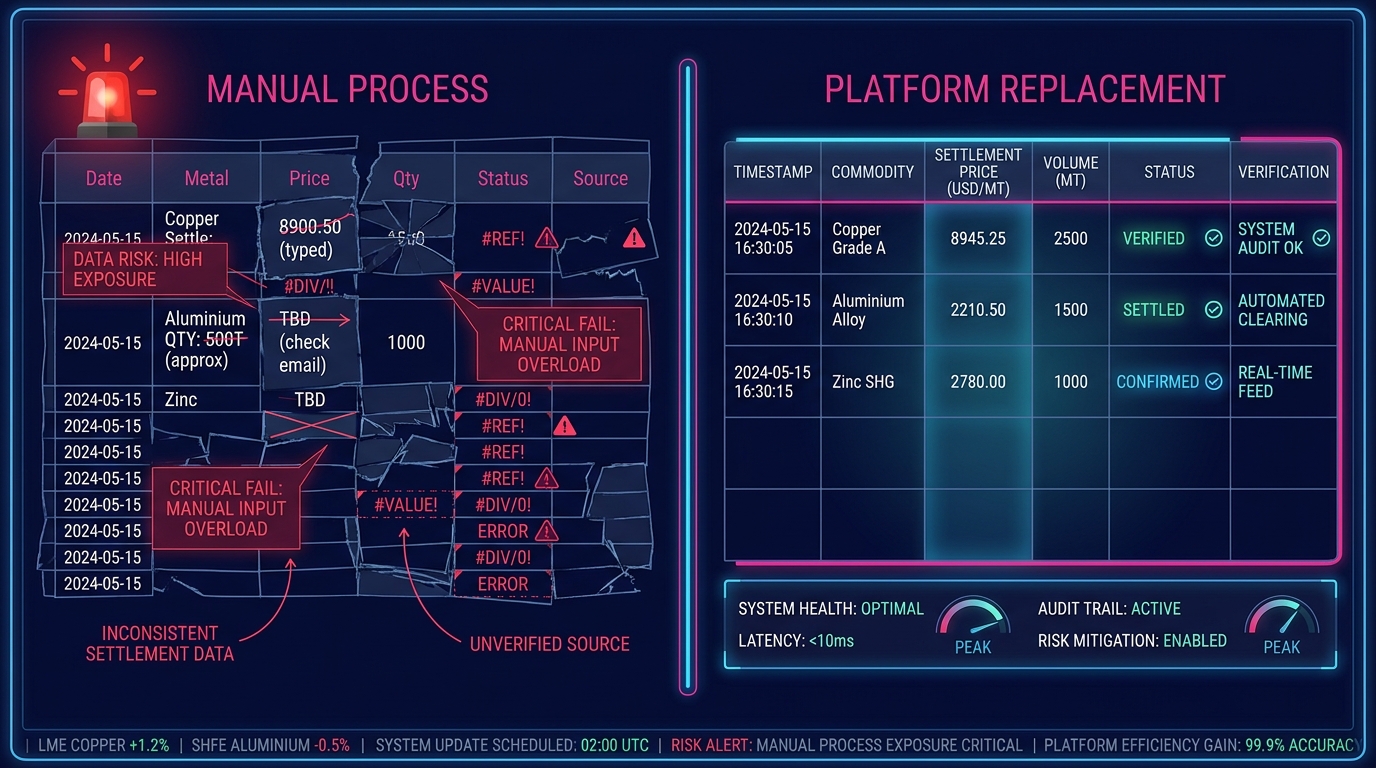
Why the Manual Daily Price Sheet Workflow Fails Under Pressure
The failure mode of a manual daily price sheet is predictable and concentrated at the moments of highest operational load. This pattern is consistent enough across metals trading operations that it constitutes a structural characteristic of the manual approach.
LME official settlement prices are published between 16:00 and 17:00 London time. COMEX final settlement arrives at 13:30 New York. MCX closes at 23:30 IST. When an operation manages exposure across multiple venues (standard for any industrial metals book spanning physical and financial positions), the daily price sheet workflow spans a six-to-eight-hour data collection window before a single confirmed P&L figure can be distributed.
How long does a manual daily metals price sheet take to complete?
A complete manual daily price sheet for a multi-venue metals position takes 2.5 to 4 hours from first price pull to confirmed distribution, depending on the number of metals covered and the complexity of FX conversion requirements. According to a 2022 Accenture survey of commodity trading operations, manual data aggregation consumes an average of 35% of a trading operations professional's working day. commodity trading operations benchmarks
This 35% concentrates at the open and close, exactly when traders need operational support focused on execution rather than spreadsheet maintenance.
The nine workflow mappings that follow are sequenced in the order they occur in a standard daily price sheet process. Each mapping defines the manual task, its inputs, its trigger condition, its output, and the platform function that replaces it.
What a Daily Metals Price Sheet Workflow Contains
Before mapping replacements, the workflow must be defined precisely. A daily metals price sheet is a multi-source data aggregation, sequential valuation, and reporting process executed against live position records, where each step depends structurally on the step before it.
What does a metals trader's daily price sheet workflow include?
A standard daily price sheet workflow for metals trading includes: settlement price collection from one or more exchanges, FX rate application for cross-currency valuations, prior-day price comparison, mark-to-market revaluation of open positions, net physical-against-financial exposure calculation, carry and basis updates, risk threshold review, report compilation, and distribution to defined teams. Each step is a discrete task with its own data dependency.
This sequential dependency is why a single data error at step one (an incorrect settlement price) invalidates every calculation downstream. The error propagates as a structural property of the workflow. sequential dependency risk in manual trading operations
The nine mappings below follow this sequence exactly.
Daily Price Sheet Workflow Replacements: Price and Rate Data
The first three mappings address the data ingestion phase: the segment of the workflow most exposed to timing delays, manual transcription errors, and source inconsistency.
What data sources feed a metals trading daily price sheet?
A metals trading daily price sheet draws from LME official settlement prices, COMEX final settlement data, MCX closing prices, SHFE settlement bulletins, spot and forward FX rates from bank or data terminal feeds, and broker-confirmed carry quotes for relevant prompt dates. Each source has a different publication time, format, and access method, requiring a defined aggregation protocol whether the process is manual or automated.
Workflow Mapping 1: Exchange Settlement Price Collection
| Field | Manual Process | Platform Replacement |
|---|---|---|
| Input | Exchange settlement bulletins, broker email confirmations | Authenticated exchange data feeds (LME, COMEX, MCX, SHFE) |
| Trigger | Manual check by operations staff at each market close | Automated polling on a defined schedule, triggered by exchange publication |
| Output | Static price cells copied into the master spreadsheet tab | Timestamped settlement prices written to a live, source-attributed price ledger |
| Error exposure | Transcription error, wrong prompt date selection, missed exchange | Feed failure flagged by exception; confirmed data carries source attribution |
The platform standard for this function uses a connected ingestion layer to retrieve confirmed settlement prices from all active exchanges simultaneously at close and writes them to a central price record, eliminating copy-paste steps, tab navigation, and file attachment parsing.
Workflow Mapping 2: FX Rate Collection and Application
| Field | Manual Process | Platform Replacement |
|---|---|---|
| Input | Bank portal, Bloomberg FX page, or Reuters terminal lookup | Scheduled FX rate feed covering required currency pairs |
| Trigger | Manual lookup initiated after price collection completes | Runs on a defined schedule; rates applied automatically at ingestion |
| Output | Currency-converted price cells dependent on manual formula | Cross-currency position valuations updated without operator intervention |
| Error exposure | Wrong rate entered, stale rate used, missed conversion for one metal | Rate staleness flagged by timestamp; conversion applied uniformly across all positions |
According to the Bank for International Settlements, daily global FX turnover exceeded $7.5 trillion in 2022, with USD/CNY alone accounting for over $700 billion. This makes rate timing a material variable for any cross-currency metals position.
Workflow Mapping 3: Prior-Day Price Delta Calculation
| Field | Manual Process | Platform Replacement |
|---|---|---|
| Input | Today's prices; yesterday's prices from a saved prior-day file or copied tab | Historical price ledger maintained automatically as a function of each settlement cycle |
| Trigger | Manual formula referencing a "yesterday" tab, saved file link, or copied row | Computed automatically from the price history at each settlement confirmation |
| Output | Delta column showing day-over-day price change per metal | Price change figures available immediately alongside each new settlement value |
| Error exposure | Broken file reference, wrong prior-date row, overwritten historical cell | No external file dependency; delta computed from a verified, immutable historical record |
Managing "yesterday's price" via a saved file or a copied row is the single most common source of stale or incorrect delta data in a metals price sheet. The platform function eliminates that construct entirely by maintaining a continuous price history that requires no operator management.
Daily Price Sheet Workflow Replacements: Position Valuation
The valuation phase is where data errors compound. An incorrect settlement price from Mapping 1 propagates through mark-to-market, net exposure, and carry calculations simultaneously, with no automatic correction mechanism in a spreadsheet environment.
Workflow Mapping 4: Mark-to-Market Revaluation
| Field | Manual Process | Platform Replacement |
|---|---|---|
| Input | Settlement prices from Mapping 1; open position records in a separate tab or file | Confirmed settlement prices from the price ledger; live position records in a unified data model |
| Trigger | Manual recalculation after prices are entered and verified by the operator | Triggered automatically when settlement prices are confirmed in the ledger |
| Output | MTM P&L column per position row, formula-dependent | Updated MTM figures available across all open positions without spreadsheet access |
| Error exposure | Formula drag failing to include new positions; circular references on partial updates | All positions in the position record are re-marked uniformly at each settlement confirmation |
The global CTRM software market was valued at $1.3 billion in 2023 and is projected to reach $2.1 billion by 2030, according to Grand View Research. This growth is driven substantially by demand to automate mark-to-market revaluation across multi-commodity and multi-venue books. CTRM market size research
Workflow Mapping 5: Net Physical-Against-Financial Exposure
| Field | Manual Process | Platform Replacement |
|---|---|---|
| Input | Physical position log (separate tab or file); hedge trade records (separate system or tab) | Unified position data model holding physical and financial records from trade entry |
| Trigger | Manual cross-reference after MTM update; frequently requires a second operator to verify | Computed continuously from live position data; no separate trigger or reconciliation step required |
| Output | Net exposure figure per metal and tenor, manually reconciled between two data sources | Net exposure by metal, tenor, and location available from the same source as MTM |
| Error exposure | Out-of-sync physical and financial tabs; trades recorded in one source but not the other | Single data model eliminates the reconciliation gap between physical inventory and hedge records |
Separate tabs or separate systems for physical and financial positions are the architectural cause of the daily reconciliation problem. The platform function resolves this at the data model level. The reconciliation gap is removed by design rather than addressed through a process applied after the fact.
Workflow Mapping 6: Carry and Basis Calculation
| Field | Manual Process | Platform Replacement |
|---|---|---|
| Input | Forward curve data from exchange publication or broker quote, typically pasted manually | Forward curve feed ingested alongside settlement prices on the same schedule |
| Trigger | Manual entry, typically mid-morning after spot prices are confirmed | Updated automatically when new curve data arrives; no operator initiation required |
| Output | Carry and basis cells used for hedging decision support | Carry and basis figures available continuously against live curve values |
| Error exposure | Stale curve data used; wrong prompt date mapping; broker quote lag | Curve data timestamped and source-attributed; prompt date mapping defined at configuration |
Copper's LME 3-month-to-cash spread moved more than $45/t in a single session during the March 2024 tightening event. For operations relying on a once-daily manual carry update, that movement occurred entirely outside the visibility window of the daily price sheet. LME copper spread volatility analysis
Daily Price Sheet Workflow Replacements: Risk and Distribution
The final three mappings address the functions that convert raw data into decisions and communication. These are the highest-value outputs of the price sheet workflow and the ones most degraded by manual process latency.
What are the risks of using spreadsheets for metals trading price sheets?
The risks of spreadsheet-based metals price sheets fall into three distinct categories. Data integrity risk: errors introduced during manual entry occur in approximately 1 in 20 cells under normal operating conditions, according to PwC audit benchmarks, and they compound at each dependent calculation. Timing risk: the sheet reflects a point-in-time snapshot that begins degrading the moment it is completed. Audit risk: no verifiable chain of custody exists from the source data to the reported figure, because the human operator is the undocumented link between them. [LINK: spreadsheet audit risk in commodity trading]
Workflow Mapping 7: Risk Threshold Review
| Field | Manual Process | Platform Replacement |
|---|---|---|
| Input | Completed price sheet with MTM P&L and exposure figures | Live position and P&L data evaluated continuously against defined threshold parameters |
| Trigger | Visual scan by operator after the sheet is fully populated and verified | Evaluated continuously against live data; a breach triggers a structured alert immediately |
| Output | Flagged rows or verbal alert to risk manager, dependent on operator attention | Structured alert routed to defined recipients when the threshold condition is met |
| Error exposure | Conditional formatting logic breaks silently; scan missed under time pressure | Threshold logic defined once at configuration; evaluation is automatic, complete, and logged |
A risk review that happens after the sheet is complete happens after the position has already moved. The platform standard for this function moves the review upstream, evaluating continuously against live data rather than retrospectively against a completed document.
Workflow Mapping 8: Report Compilation and Distribution
| Field | Manual Process | Platform Replacement |
|---|---|---|
| Input | Verified price sheet, manually formatted into a report template | Confirmed price, position, and P&L data pulled from the central record at report generation time |
| Trigger | Manual initiation after all cells are verified, formatted, and cross-checked | Scheduled report run at a defined time; output generated from confirmed data without operator action |
| Output | PDF or Excel report emailed to risk manager, finance team, and senior trader | Formatted report generated and distributed to a defined, configuration-managed recipient list |
| Error exposure | Wrong file version attached; formatting errors in copied cells; missed recipient | Report reflects confirmed data at the moment of generation; recipient list is persistent configuration |
According to a 2023 Deloitte analysis of commodity trading operations teams, report compilation and distribution consumed an average of 45 minutes per day for teams managing multi-venue positions manually. This time is fully recoverable through platform-driven generation. Deloitte commodity trading operations efficiency report
Workflow Mapping 9: Historical Price and Position Archive
| Field | Manual Process | Platform Replacement |
|---|---|---|
| Input | Completed day's spreadsheet file | All confirmed price, position, P&L, and distribution data written at each settlement cycle |
| Trigger | Manual save-as with a date stamp; often delegated or skipped under workload pressure | Written automatically as a function of the settlement confirmation process; no operator step required |
| Output | Date-stamped file in a shared folder, searchable only by file name and folder structure | Structured historical record queryable by date, metal, contract, prompt date, and user |
| Error exposure | Missing files, inconsistent naming conventions, overwritten versions, inaccessible archives | Record is complete, immutable, and accessible without navigating a file system |
An audit request for a specific metal's settlement prices across a six-month prior period takes, on average, four to six hours to fulfill manually from a spreadsheet archive. The same query against a structured historical record takes under 30 seconds. This distinction represents the difference between a system of record and a collection of snapshots.
The Audit Case for Automated Price Sheet Workflows
Each of the nine mappings above produces an audit implication alongside the operational improvements.
How do CTRM platforms replace manual price sheet processes?
CTRM platforms replace manual price sheet processes by maintaining a continuous, source-attributed record of every price, rate, position valuation, and distribution event, eliminating the human operator as the undocumented link between data source and reported output. The platform removes the need for the spreadsheet entirely.
EMIR, MiFID II, and exchange-level reporting frameworks for commodity trading all require documented chains of custody from source data to reported position. EMIR reporting requirements for commodity trading firms
A spreadsheet-based daily price sheet cannot satisfy that requirement because the spreadsheet contains values without provenance. A connected platform writes provenance (source, timestamp, operator record, confirmation status) at every data point as a structural property of the record.
This marks the structural difference between a system of record and a working document.
From Spreadsheet to Platform: What the Transition Requires
The nine mappings above define what changes. The transition question is what the change requires operationally.
The most common consideration when replacing a daily price sheet workflow is that the existing spreadsheet reflects real operational specificity. This includes particular position structures, tenor conventions, FX pair combinations, and reporting preferences built over time. That specificity is accurate and requires a direct answer, as it also serves as the source of the operational fragility being replaced.
A spreadsheet customized to a specific operation is a brittle artifact. One staff departure, one new metal added to the book, or one new regulatory reporting field can break it. When this happens, the customization must be rebuilt from formula-level understanding that is rarely documented and cannot be transferred as a defined configuration.
Platform configuration is a different construct. It defines the metals covered, the exchanges sourced, the FX pairs applied, the prompt date conventions used, and the report format required. That configuration is persistent, transferable, and auditable in a way that cell-level spreadsheet logic cannot be.
According to McKinsey's 2023 analysis of commodity trading operations transformation, firms that replaced manual daily valuation and reporting workflows with platform-driven processes reduced operational error rates by an average of 62% and reclaimed 1.8 hours per trading day per operations professional. McKinsey commodity operations transformation research
The nine tasks mapped in this document account for the majority of those hours, and for the majority of the error exposure those firms eliminated.
Three Actions to Take Against This Map
This document has defined nine manual tasks in a metals trading daily price sheet workflow, mapped each to its platform replacement, and specified the input, trigger, and output of both the manual and automated version.
The immediate next steps for any metals trading operation evaluating this replacement are concrete:
- Audit your current daily price sheet against these nine mappings. Most operations will find six to eight of the nine apply directly. Identify which steps are currently manual, which are partially automated, and which have known error histories.
- Document your FX pairs, exchange sources, and prompt date conventions. Platform configuration is determined by the markets you trade, not by a vendor's default setup. Having this documented before any evaluation conversation accelerates the process considerably.
- Quantify your daily time allocation for price sheet tasks. The operational case for replacement is strongest when grounded in measured hours rather than estimated ones. Track one week of price sheet workflow time against the nine categories above.