Depth-First Intelligence: LME Data Breadth Platforms Miss
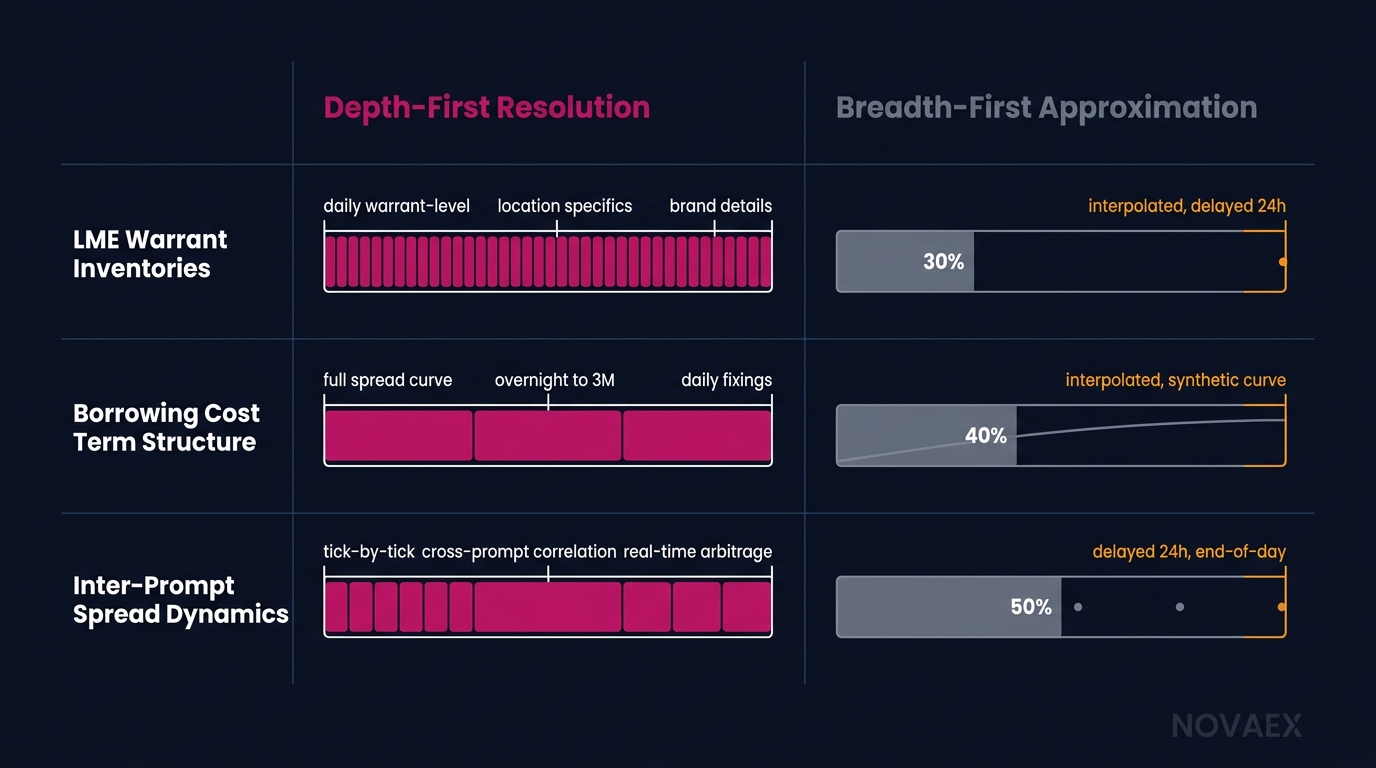
Depth-first commodity intelligence means owning every layer of exchange-native data for a specific market before claiming competency in it. For base metals, that begins with three non-negotiable constructs: LME warrant inventories, borrowing cost term structures, and inter-prompt spread pricing. Breadth-first platforms approximate all three. That approximation carries a measurable, position-level cost.
Front-office metals traders already sense this gap. It surfaces when a platform's copper position shows a clean number while the LME warrant market is in the middle of a cancellation event. It surfaces when a borrow rate appears as a single annual percentage instead of the daily tom-next ladder it actually is.
This post defines depth-first precisely, not as a contrast to breadth-first, but as a positive operational standard with named data constructs, specific resolution requirements, and traceable failure modes in the platforms that fall short.
What Depth-First Intelligence Actually Means
Depth-first is not a philosophy. It is a data architecture decision.
A depth-first platform ingests the primary source data structure of each exchange it covers, not a normalized downstream feed derived from it. For LME copper, that means warrant-level inventory records by location and status, full term-structure borrowing rate ladders with daily prompt granularity, and spread matrices reflecting actual market-observable bid/ask on every inter-prompt pair.
According to the LME's published market data specifications, copper warrants are held across 29 approved warehouses in 14 global locations LME approved warehouses list, with daily warrant and cancelled-warrant counts reported separately for each location. A platform that surfaces a single aggregate "LME copper stocks" number has already discarded the data structure that carries the signal.
The breadth-first alternative normalizes this into a coverage-friendly format: one number, one field, one update frequency. The normalization is operationally convenient. It is also structurally inadequate for any trader whose position depends on knowing where metal sits and what status it holds.
The Difference Between Live and Cancelled LME Warrants
A live warrant represents metal available for lending or future delivery in an LME-approved warehouse. A cancelled warrant represents metal earmarked for physical withdrawal. It has been removed from the deliverable pool and is no longer available to back a short position. The cancelled-warrant-to-total-warrant ratio is one of the market's most watched leading indicators of near-term physical tightness.
In late 2021, LME copper cancelled warrants reached 92% of total LME copper stocks, a structural squeeze precursor that materialized weeks before the cash-to-3-month backwardation briefly exceeded $1,100 per metric tonne in October of that year LME October 2021 copper market data. A platform displaying only total LME copper stocks missed this signal, not by hours, but by weeks. The warrant-status field is not supplementary data. It is the primary data.
LME Warrant Inventories: What Breadth Platforms Flatten
The LME's warrant system is structurally distinct from inventory reporting at CME Group, SHFE, or MCX. This distinction is the first point at which breadth-first platforms introduce systematic error.
CME Group's COMEX copper (contract symbol HG, 25,000 lb lots) reports registered and eligible stocks in approved depositories, but COMEX copper functions primarily as a financially settled hedging vehicle. COMEX copper contract specifications Physical delivery accounts for under 2% of open interest at expiry, making the warrant-equivalent mechanism largely irrelevant to live spot pricing.
SHFE copper publishes inventory reports every Friday after market close, measured in metric tonnes across approved Shanghai warehouses. SHFE does not operate a warrant system analogous to the LME's. It uses a bond (仓单) system in which registered warehouse receipts are updated weekly, not daily. That seven-day reporting lag is a genuine data gap, not a rounding artifact.
MCX copper in India settles against the LME official price converted via the Reserve Bank of India's USD/INR reference rate, with a domestic premium or discount overlaid. MCX does not maintain an independent warrant-level inventory system for copper physical delivery at meaningful scale.
Each structure requires different native data ingestion. A breadth-first platform that normalizes all four into a single "exchange inventory" field has not unified the data. It has eliminated the distinguishing characteristics that make each structure analytically meaningful.
The Impact of Warehouse Location on LME Copper Pricing
LME copper prices are not uniform across all approved delivery locations. The LME publishes location premiums (also called location differentials) reflecting transportation costs and regional physical demand imbalances. Metal held in Johor (Malaysia), New Orleans, Rotterdam, and Hamburg trades at different effective delivered prices. According to LME published data, location premiums for copper can range from $3 to $15 per metric tonne depending on warehouse location and prevailing freight rates. LME location premium structure
When a breadth-first platform aggregates all LME copper stocks into a single inventory figure, it eliminates the location signal. This is precisely the signal a physical trader uses to manage delivery, freight, and warrant-borrowing decisions. A trader long a Rotterdam warrant and short a Johor position is not flat. A platform showing only total LME stocks says they are.
Borrowing Cost Term Structures: Where Approximation Costs Most
The LME's forward curve is not a standard yield curve. It is a prompt-date structure with daily granularity from spot to 3 months, weekly granularity from 3 to 6 months, monthly granularity from 6 to 15 months, and quarterly granularity from 15 to 63 months for primary metals including copper. LME prompt date structure documentation
At any given time, this creates approximately 4,000+ individually observable prompt dates across the full LME copper forward curve. Each prompt-to-prompt spread is a separate data point reflecting the market's current assessment of borrowing cost, physical availability, and financing rates for that exact tenor.
Breadth-first platforms reduce this to a single metric: the cash-to-3-month spread. This is the analytical equivalent of describing a government bond yield curve using only the 2-year and 10-year data points. It is technically not wrong, and functionally insufficient for anyone who actually trades the curve.
What the LME Cash-to-3-Month Spread Actually Measures
The LME cash-to-3-month spread (C/3M) measures the cost of borrowing or lending metal between the spot settlement date (T+2) and the 3-month forward date. When cash trades at a premium to 3-month (backwardation), borrowing metal is expensive, signaling physical tightness. In normal contango conditions for copper, the C/3M spread runs approximately $15 to $30 per metric tonne, roughly in line with 3-month SOFR-equivalent financing costs plus LME warehouse rent of approximately $0.40 to $0.48 per metric tonne per day. [LINK: LME published warehouse rent schedule]
But C/3M is a blended average of 65 individual daily prompt-to-prompt spreads between cash and 3 months. Each daily spread has its own supply-demand balance, driven by which specific prompt dates carry concentrated open interest or nearby delivery obligations. In a developing squeeze, the first 5 to 10 business days of the curve can trade in extreme backwardation while the outer portion remains in contango. A platform showing only C/3M shows the blend, not the signal.
The October 2021 LME copper event provides the clearest quantified illustration of this gap. The tom-next rate (the one-day borrowing cost from tomorrow to the next business day) reached intraday levels exceeding $100 per metric tonne at peak. The simultaneous C/3M spread was approximately $600 to $800/t. A platform displaying only C/3M gave a trader a borrow-cost number that underrepresented their immediate prompt exposure by a factor of 5 to 10x. That is not an approximation error. It is a different data point.
Inter-Prompt Spreads: The Precision Gap in Depth-First Analysis
Inter-prompt spread trading on the LME is one of the most technically demanding workflows in base metals. Every hedge against a physical forward position involves selecting a specific LME prompt date matched, or deliberately mismatched, to a physical delivery date. The spread between two non-standard prompt dates, such as the 47th and 52nd business days forward, is not derivable from C/3M with meaningful accuracy.
During the LME Ring trading session (11:40 to 17:00 London time) and LME Select electronic trading (01:00 to 19:00 London time), the LME publishes official bid/ask spreads for all prompt-date pairs out to the 3-month date. LME Select trading hours and data specifications These are market-observable values generated by Category 1 Ring-dealing members with market-making obligations. They are not computed estimates.
The Effect of Inter-Prompt Spreads on Hedge Ratios
When a physical trader hedges a copper shipment arriving on a specific non-standard date, the effective hedge ratio and carry cost depend on the exact inter-prompt spread between the expected arrival date and the nearest standard prompt. If that spread is in backwardation, rolling the hedge forward incurs carry cost. If it is in contango, rolling generates carry income. On a 500-metric-tonne position, a $1/t error in the inter-prompt spread assumption translates to a $500 P&L error per prompt roll, compounding across multiple rolls in a physical trading book. LME hedging mechanics and prompt date management
Breadth-first platforms estimate inter-prompt spreads by interpolating linearly between the nearest published reference points. Linear interpolation assumes the curve shape is uniform between observable points. In practice, the LME prompt curve has structural kinks at cash, tom-next, and the 3-month date. These are discrete discontinuities created by delivery concentrations and market-making obligations. Interpolation smooths these kinks away. It does not model them.
Quantified Resolution Gaps by Spread Type:
Tom-next: LME Select live bid/ask (Depth-First Source) vs Interpolated from C/3M (Breadth-First Method). Typical Error Range: $2 to $100+/t (event-dependent).
Specific daily prompt (cash to 3M): LME official Ring price (Depth-First Source) vs Interpolated mid-market (Breadth-First Method). Typical Error Range: $0.50 to $5/t (normal); $10 to $50+/t (stressed).
Week-to-week (3 to 6 months): LME official weekly prompt (Depth-First Source) vs Interpolated from monthly (Breadth-First Method). Typical Error Range: $1 to $8/t.
Monthly (6 to 15 months): LME 3rd Wednesday official (Depth-First Source) vs Interpolated from quarterly (Breadth-First Method). Typical Error Range: $2 to $15/t.
Sources: LME published official prices, LME Select data feed technical specifications.
How Breadth-First Platforms Introduce Systematic Error
The failure mode of breadth-first platforms is structural, not incidental. It is the direct consequence of prioritizing coverage width over data resolution depth.
A platform covering 50+ commodities cannot maintain native ingestion pipelines for LME warrant-level data, SHFE bond system weekly reports, COMEX registered versus eligible stock distinctions, and MCX settlement reference structures simultaneously while also covering crude oil, natural gas, agricultural futures, and freight indices. Something gets normalized. The normalization is where precision is permanently discarded.
Why Multi-Commodity Platforms Struggle with LME Prompt Structure
The LME's prompt structure is non-standard by design. Unlike CME futures contracts, which expire on fixed calendar dates (typically the third Wednesday of the contract month), LME prompts fall on every business day. Maintaining a data model that accommodates daily LME prompts, weekly SHFE bond reports, and monthly MCX settlement references in the same schema requires fundamentally different database architecture than a commodity-generalist platform is built to support.
According to industry research on CTRM/ETRM implementation outcomes, over 60% of base metals trading firms identify data reconciliation as a top-three operational pain point, with prompt-date mismatches cited as the most common root cause of position discrepancies. CTRM/ETRM industry survey on base metals data challenges These limitations are documented. They appear in implementation footnotes and vendor data-quality disclosures. The front-office trader encounters them in production.
The operational consequence is predictable: a metals trader on a breadth-first platform maintains a parallel spreadsheet layer to manage prompt-date precision, borrow rate laddering, and warrant-status monitoring. This is not a workflow preference. It is an architectural constraint imposed by the platform's coverage model.
The Depth-First Standard: Four Operational Properties
Depth-first intelligence is defined positively by four operational properties that are verifiable against published exchange data specifications, not by marketing contrast.
- Native source ingestion. Data is pulled directly from exchange-published primary feeds (LME data services, SHFE official reports, COMEX market data) without intermediate normalization that discards field granularity. The data model reflects the exchange's own structure, not a normalized commodity-generalist schema.
- Prompt-date resolution. Every LME prompt date is individually addressable in the data model. Spreads between any two prompt dates are market-observable values sourced from LME Select or Ring pricing, not interpolated estimates derived from reference point pairs.
- Warrant-status granularity. LME inventory is represented as live warrants, cancelled warrants, and on-warrant metal by individual warehouse location. These are three separately queryable fields that map to the LME's own published stock report structure, not one aggregate figure.
- Real-time borrow rate laddering. Borrowing costs are represented as a ladder of individual prompt-to-prompt rates from tom-next through the full daily sequence to 3 months, then through weekly and monthly tenors. C/3M is a derived output of this ladder, not the primary input.
The three constructs covered in this post are connected in practice, not just in theory. When LME cancelled warrants spike past 50% of total stocks, the correct analytical response is to examine the tom-next rate, not the C/3M spread, because the physical pressure is manifesting in the nearest prompt, not the blended 3-month average. When the tom-next rate begins moving independently of C/3M, the next query is warehouse location: which LME-approved locations are receiving cancellations, and which are approaching capacity constraints that will affect physical delivery optionality. These are sequential, connected queries. A depth-first platform executes all three in seconds. A breadth-first platform handles the first, approximates the second, and cannot execute the third.
Measuring the Gap: Your Next Three Steps
The data gaps defined in this post are testable against any platform currently in use. The answers take minutes to obtain and are unambiguous.
Request your platform's inter-prompt spread for any non-standard LME copper date 23 business days forward. Ask the vendor directly: is this value market-observable from LME Select, or is it interpolated? Ask for the cancelled-warrant count by individual warehouse location for the most recent date on which LME copper C/3M backwardation exceeded $50/t. Request the tom-next rate ladder for any five consecutive business days in the last 12 months.
The answers define whether your current platform is depth-first or depth-approximate. There is no intermediate category.
Three immediate actions to take:
- Audit your current data resolution across the three constructs. For each of the three LME data constructs covered here (warrant inventories, borrowing cost term structures, inter-prompt spreads), document whether your current platform provides market-observable exchange-native values or interpolated estimates. The audit takes one day and produces a clear gap assessment. depth-first audit framework
- Quantify your spread error exposure on live positions. On your largest current copper hedge, identify the exact LME prompt date used and calculate the difference between your platform's reported inter-prompt spread and the LME official value for that date. At 500 tonnes, each $1/t of spread error costs $500 per roll. Across a 12-month hedge tenor with quarterly rolls, the compounding is material. prompt-date hedge exposure calculator
- Request the Novaex depth-first data specification. The specification documents exactly how warrant-level, prompt-precise, and borrow-rate-granular LME data is ingested, stored, and surfaced in a front-office platform built to the standard described in this post. It is a functional specification, not a marketing document, and it can be evaluated directly against your current platform's data model. Novaex depth-first data specification request