How to prove year-end hedge coverage to the board
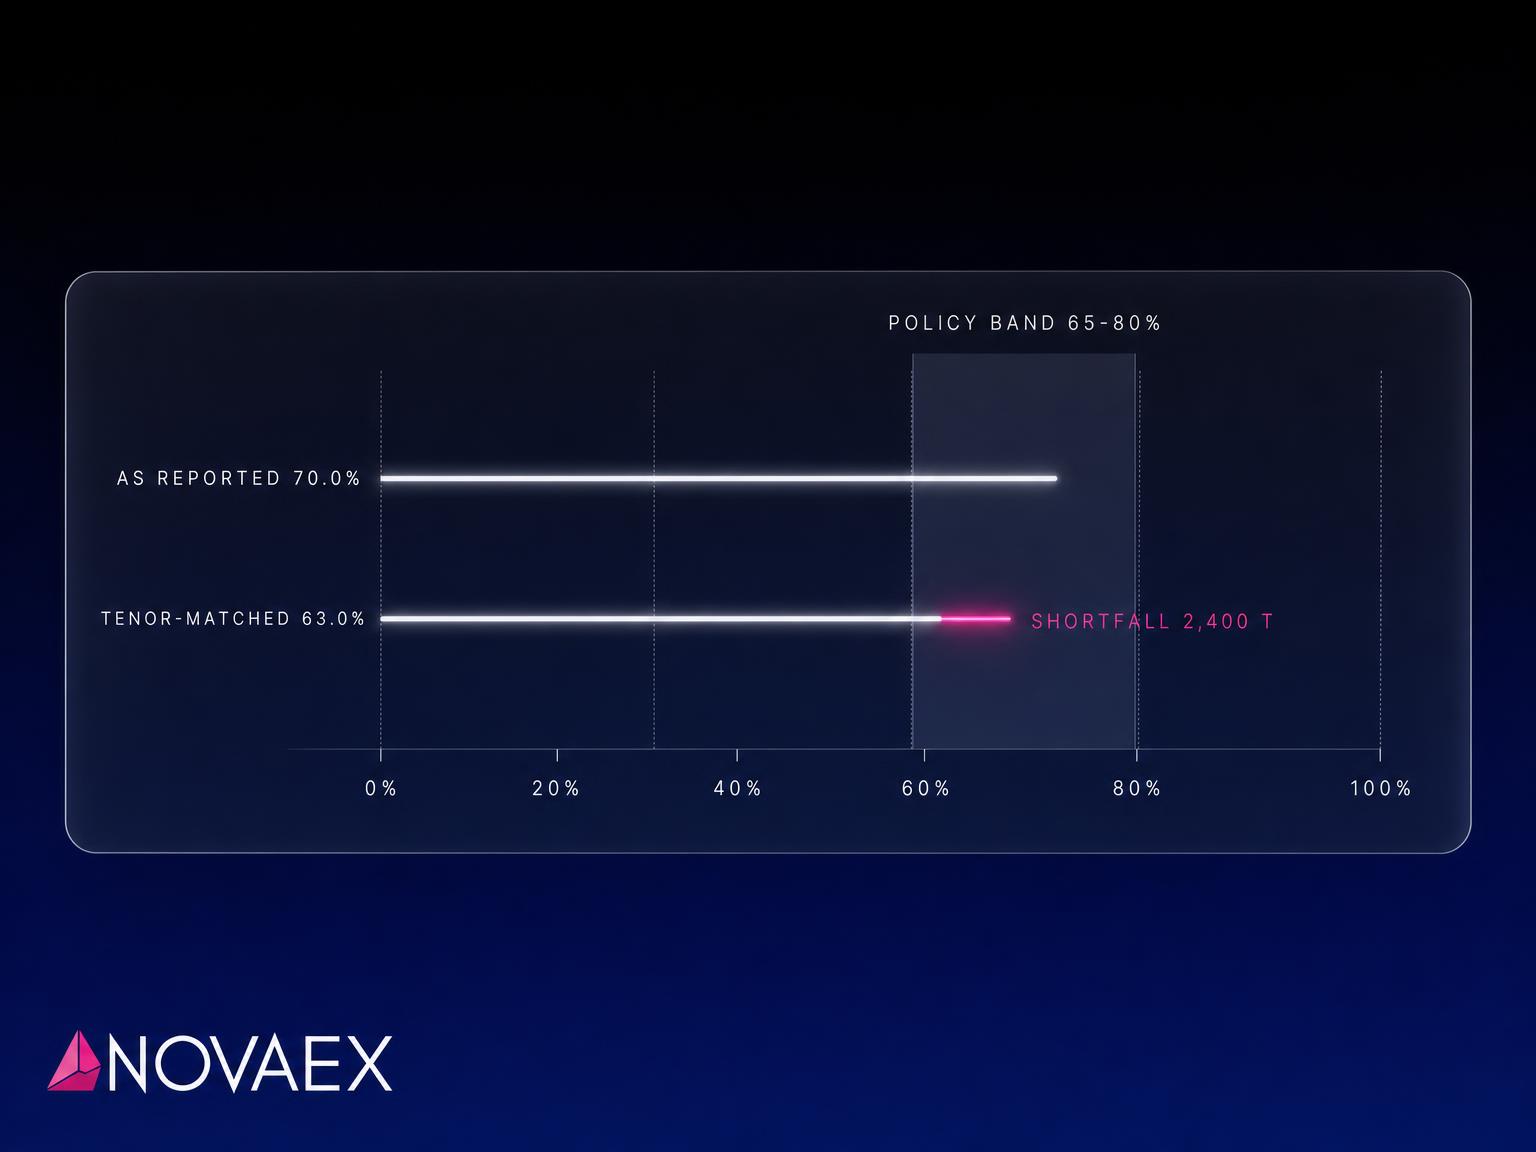
Two readings of the same hedge book can both be right and still disagree about policy. What the evidence pack needs, and where the coverage claim breaks.
Proving year-end hedge coverage means showing one number: tonnes hedged against tonnes of board-approved production, inside the policy band, by delivery period, with the physical and financial books reconciled behind it. A coverage percentage that cannot be traced line by line to both books is a claim, not evidence.
Where does a hedge coverage claim break?
It breaks at the denominator and at the dates. Two readings of the same book can both be arithmetically right and still disagree about whether you are inside policy.
Here is an illustration. The figures are hypothetical, chosen to show the working, not drawn from any producer's book.
Board-approved production for the period: 120,000 t.
Policy band: hedge 65% to 80% of approved production, which is 78,000 t to 96,000 t.
Financial book: 84,000 t sold forward. That reads 70.0%, inside the band.
Now go line by line. Of those 84,000 t, 8,400 t mature before the production month they were placed against. For the period the board is asking about, they no longer cover anything. Tenor-matched, the book holds 75,600 t, which is 63.0%.
The floor is 78,000 t. The book is 2,400 t short. Same hedges, same day, two answers, and only the second one survives an auditor reading the trade list against the production plan.
What evidence does the board actually need?
The board needs a reconciled schedule it can check, not a percentage it has to trust. Boards tend to ask what the policy said, so the pack should show the policy test first and the working behind it. Mobius puts the board's question as "what was our policy", and the answer has to be demonstrable.
A pack that holds up carries five things:
The policy band, quoted exactly. Minimum and maximum, the exposure it applies to, and the date the board approved it.
The denominator, with its version. Which production plan, approved when, and what has changed since.
The numerator, by delivery period. Every hedge, its tonnes, its maturity, the production month it covers.
The reconciliation to the physical book. Tonnes already priced in physical contracts, tonnes still open to the LME price, and where the two books disagree.
The exceptions. Every line that sits outside the band, with the reason and who approved it.
An FX-focused hedging programme guide describes the same shape for a standing report: actual hedge ratios against policy targets, by time bucket. The structure carries over to metals unchanged.
Why does the physical book move the number?
The physical book decides what you are covering. A tonne already sold at a fixed price is not exposed to the LME price the way an open tonne is, so whether it counts toward coverage is a question the policy has to answer in words, not one the spreadsheet should settle quietly.
Three physical-side questions decide most of the disagreements:
Does fixed-price physical sales tonnage count as coverage, or only as a reduction of exposure? Write the policy's answer next to the figure.
Has production been reforecast since the board approved the plan? Policy usually tests against approved production, so the board should see both the approved and the reforecast denominator.
Are the quotation periods on purchase and sale the same? A mismatch moves basis between the two legs and leaves tonnes covered on paper but open in practice.
If these are answered in different files, the coverage figure is assembled by whoever last touched the sheet. That is how a number reaches the board that nobody can reproduce a month later.
Who needs to be able to reproduce it?
Someone other than the person who built it. A board-approved policy only means something if the people who confirm and report are separate from the people who trade. Mobius lists segregation of duties as essential, and names vague objectives, no hard limits and valuation treated as an afterthought among the predictable failures.
In practice, that means the coverage schedule should be rebuilt from the trade confirmations and the production plan by a second pair of hands, and the two results should match to the tonne. Where they do not, the difference is the finding.
Does hedge accounting change the evidence?
It adds a layer on top. If you designate hedge relationships, the documentation has to show the economic relationship between hedge and hedged item. Under IFRS 9 that test is principles-based: IAS Plus describes the removal of the 80% to 125% bright line that applied under IAS 39. Your accounting team and auditors set that standard, and the policy-coverage schedule should feed it rather than compete with it.
What does a clean year-end answer look like?
One page, one number per delivery period, each traceable to a trade and a production line. The policy band is drawn on it, the shortfall, if any, is marked, and the reason sits beside it.
No common year-end review date holds across regions, so build this as a standing report instead of a calendar scramble. The coverage figure you can reproduce on any day is the one that survives the question when the board asks.
At Novaex, this is the job Ledger does: physical, hedge and broker positions reconciled into one view, with the trail behind each figure available line by line. The schedule above is what we would want to see on the table.
Which of the five items is hardest to produce in your book today?