LME Carry Curve Pricing Breaks: Contango vs. Backwardation
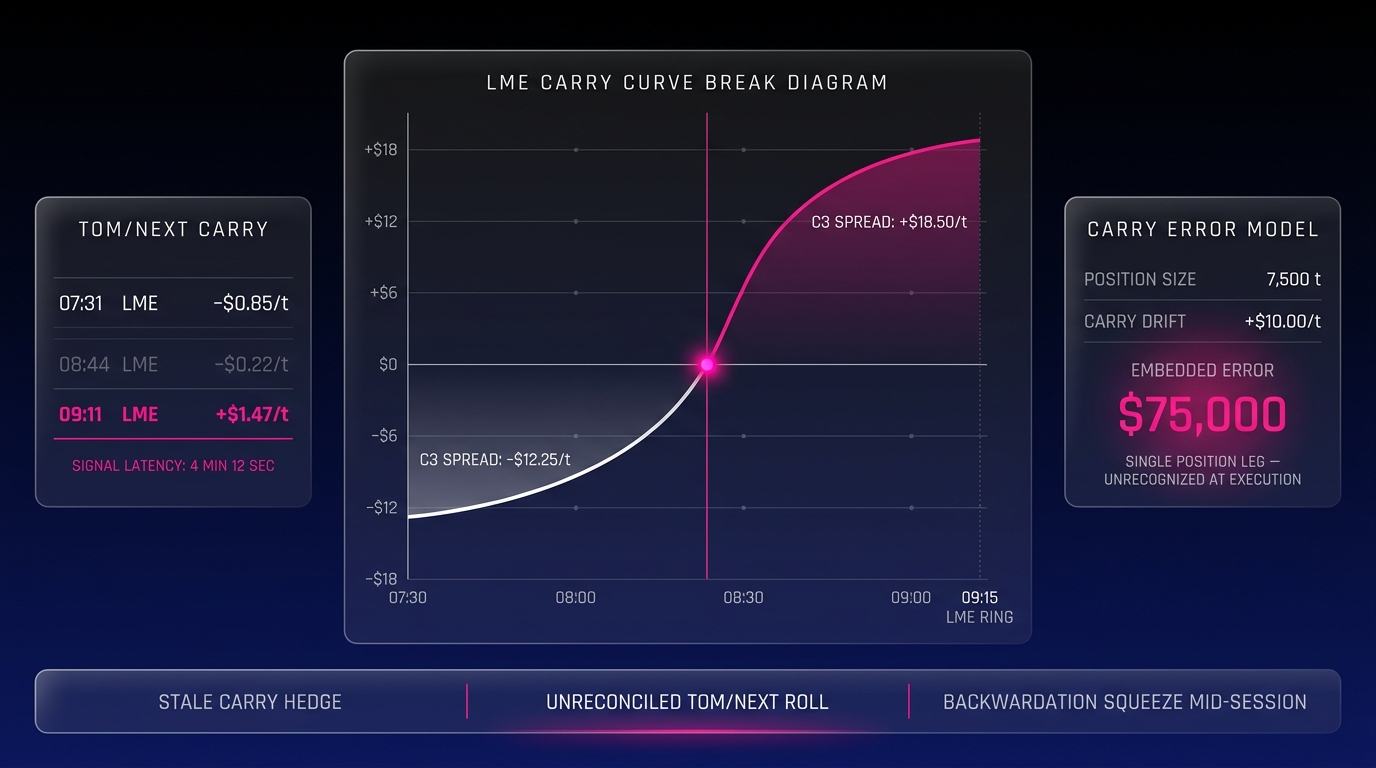
When the LME carry curve transitions from contango to backwardation mid-session, any team pricing against a signal refreshed in the last 90 seconds is already operating on stale data. That gap (between what the market structure is and what your system says it is) is where LME carry curve pricing breaks occur.
TL;DR: LME carry curve pricing breaks happen when a contango-to-backwardation shift moves faster than your signal refresh rate, forcing execution against carry differentials that no longer reflect live market structure. This is an architectural issue.
This analysis traces these mechanics precisely, from the LME's underlying prompt date structure through each named pricing break scenario and its book-level propagation.
What the LME Carry Curve Actually Measures
The LME does not operate on a standard monthly futures calendar. It prices on daily prompt dates extending three months forward, then weekly to six months, then monthly to 63 months. The carry curve, specifically the cash-to-three-month (C3) spread, is the primary structural signal that tells a metals trader whether the market is in contango or backwardation at any given moment.
LME Carry Curve Structure
The LME carry curve is the set of spread values across consecutive prompt dates, with the cash-to-three-month spread serving as the benchmark instrument. Each prompt date carries its own bid/offer spread, and the curve's shape, sloping upward into contango or inverting into backwardation, tells you the cost or benefit of carrying a position through time. The curve reprices continuously during open-outcry ring sessions and electronic trading hours on LMEselect.
This structure matters for one operational reason: every physical pricing formula referenced to LME is implicitly anchored to a specific point on this curve. A contract priced at "LME cash plus $45/tonne" is sensitive not just to the absolute price of the metal but to where the cash prompt sits relative to the date of physical delivery.
The tom-next (TOM/NEXT) spread, the overnight carry from tomorrow to the next business day, is even more granular. It is the instrument traders use to roll prompt positions forward without taking physical delivery. According to LME data, copper's TOM/NEXT spread can move 3 to 6 ticks in a single ring session under normal conditions, and significantly more during stressed periods. LME prompt date structure and carry mechanics
Every pricing decision a metals desk makes during the session depends on the accuracy of these two signals: the C3 spread and the TOM/NEXT rate. When either is stale, any pricing decision based on that signal carries embedded carry error prior to execution.
LME Contango: The Carry Structure That Hides a Timing Problem
In LME terms, contango means the three-month price is higher than the cash price. The market is paying you to defer delivery. Warehouses hold stock, financing costs are visible, and the carry is predictable enough that you can price a forward physical deal with reasonable confidence that today's C3 spread approximates tomorrow's.
The Impact of Contango on Physical Metals Trading
For a physical trader in contango, the carry spread functions as a known cost that can be incorporated into a forward pricing model. If the C3 spread is -$12/tonne (cash is $12 below 3-month), you expect to pay approximately $12/tonne to roll a long cash position to 3-month. That expectation lets you price a fixed-price forward sale with a defined hedge cost embedded in the margin structure.
The actual risk emerges when contango erodes toward flat.
When the C3 spread compresses from -$12 to -$3 over three sessions, a team refreshing carry signals every 4 to 5 minutes may never see the intermediate steps. They see two data snapshots: -$12 and then -$3. The price quoted against the -$12 reading already has an embedded mispricing, and the position booked at that price will not reveal it until end-of-day reconciliation.
This is Pricing Break Scenario One: the Stale Carry Hedge. A trader prices a physical forward at T=0 using a carry signal last refreshed at T-minus-4 minutes. The C3 spread has already moved 6 ticks in that window. The hedge they place covers the correct absolute price but the wrong carry differential. The P&L gap appears at reconciliation, not at execution.
According to research on execution quality in commodity markets, a 4-minute data latency during a directional carry move translates to pricing errors of $2 to $8/tonne on copper hedges, depending on position size and spread velocity. commodity data latency and execution quality research At 7,500 tonnes, the lower bound of that range is $15,000 of unrecognized exposure on a single deal leg.
LME Backwardation: When the Curve Flips and Pricing Breaks Happen
In LME terms, backwardation means the cash price is higher than the three-month price. The market is paying a premium for immediate delivery. Someone needs metal now, or a dominant position holder controls enough nearby warrants to make nearby settlement difficult for shorts who need to roll.
Backwardation is not a theoretical condition. The LME copper market moved into sustained backwardation in late 2021, with the cash-to-3-month spread reaching +$1,100/tonne in October 2021 during a documented warrant concentration event, a move that created extraordinary roll costs for anyone short nearby positions. LME 2021 copper cash spread backwardation event
Triggers for a Backwardation Squeeze
Backwardation squeezes on the LME are typically triggered by three conditions: a dominant long position holder concentrating warrants in nearby prompts, a sudden drawdown in LME warehouse inventory reducing available nearby stock, or a demand spike from physical consumers requiring immediate delivery. Each condition tightens the cash premium relative to forward months and compresses the ability of shorts to roll positions at manageable cost.
The critical operational variable is speed of onset. During the October 2021 copper event, the C3 spread moved hundreds of dollars per tonne across individual sessions. More routine backwardation events (inventory-draw-related tightening rather than squeeze events) still move 15 to 30 ticks in under 30 minutes during active ring sessions. LME copper cash-3 month spread historical data
This is Pricing Break Scenario Two: the Unreconciled TOM/NEXT Roll. A trader enters the session with a TOM/NEXT roll queued based on a carry signal from the morning system refresh. Between that refresh and execution, the cash premium moves 12 ticks. The roll executes at a carry cost $6/tonne worse than the model projected. The position is now unreconciled against the risk system until the next refresh cycle captures the updated spread level.
The discrepancy does not always trigger an alert. Many legacy CTRM systems flag pricing breaks only when divergence exceeds a fixed threshold, typically calibrated to normal contango conditions rather than backwardation events. The break sits undetected until an end-of-day mark reveals the variance. By then, the book has already priced two more deals against the same stale carry structure.
Minutes vs. Ticks: Why Signal Refresh Rate Is the Core Problem
Carry Curve Velocity per Minute
During active ring sessions, copper's C3 spread can move 4 to 8 ticks per minute in trending conditions and 10 to 15 ticks per minute during a squeeze-related event. Each tick in the C3 spread on copper represents $0.25 to $0.50/tonne depending on the specific prompt interval. A 10-tick move in 60 seconds translates to $2.50 to $5.00/tonne in carry cost change, before position size.
Here is the operational gap in precise, unit-specific terms:
At a 1-minute refresh rate, a carry signal is potentially 60 seconds stale before a trader prices against it. At 10 ticks/minute carry velocity, the maximum embedded pricing error is $5.00/tonne.
At a 5-minute refresh rate, that maximum error expands to $25.00/tonne on copper, before position size multipliers.
At tick-level refresh, the carry signal is current to the last transaction in the spread market. The embedded pricing error approaches zero.
This is a direct measurement problem with a calculable cost. A team running a 300-lot copper hedge (7,500 tonnes) against a carry signal with a $10/tonne embedded error is carrying $75,000 of unrecognized P&L exposure on a single position leg. LME lot size and contract specifications
According to a 2022 survey by Commodity Technology Advisory (ComTech Advisory), over 60% of mid-market commodity trading firms still rely on CTRM data refresh cycles measured in minutes rather than ticks. ComTech Advisory CTRM technology survey This limitation stems from legacy system design. Legacy CTRM platforms were designed for daily settlement workflows. Their data ingestion pipelines batch-process market data feeds, which means every carry signal displayed to a trader is aged by the batch interval before it reaches the screen, regardless of how fast the underlying market is moving.
Legacy architectures cannot be resolved by adjusting a refresh setting. They require a fundamentally different data pipeline.
Three Named Pricing Break Scenarios Every Metals Trader Faces
The three scenarios introduced above are not edge cases reserved for squeeze events or crisis markets. They are recurring structural risks in any LME metals operation where carry signals are refreshed in minutes rather than ticks.
Scenario One: The Stale Carry Hedge: A physical forward is priced against a C3 spread that has already moved. The hedge executes at the correct absolute price but the wrong carry differential. The error is invisible at execution and appears at end-of-day reconciliation as unexplained P&L variance.
Scenario Two: The Unreconciled TOM/NEXT Roll: A position roll executes against a TOM/NEXT spread that moved since the last system refresh. The roll cost exceeds the modeled cost. The position's risk metrics are incorrect until the next batch refresh captures the updated spread, a window that can span 4 to 6 minutes at typical legacy refresh rates.
Scenario Three: The Backwardation Squeeze Mid-Session: This is the highest-severity scenario. A trader managing a short nearby position continues pricing new deals as backwardation sharpens mid-session. Their carry risk signal shows a manageable cash premium. The live market is $15/tonne worse. Multiple pricing decisions execute against incorrect carry structure before the system refreshes and reveals the dislocation.
According to Oliver Wyman's commodity risk management research, undetected carry pricing errors are among the top three sources of unexplained P&L variance in physical metals trading operations. Oliver Wyman commodity trading risk management report The commonality across all three scenarios is the same: a pricing decision made in real time against a carry signal that is measuring a market structure that no longer exists.
The Impact of Carry Curve Pricing Breaks on Hedge Effectiveness
A carry curve pricing break degrades hedge effectiveness by creating a mismatch between the carry differential embedded in the physical pricing formula and the actual carry cost of the hedge instrument. If a physical contract references LME cash and the hedge is placed in the 3-month contract, any movement in the C3 spread between pricing and execution creates residual exposure that is not captured in the hedge ratio. This residual is not visible in position reports until reconciliation.
The compounding effect is non-linear across a book. A single $3/tonne carry error on a 500-lot position is $187,500 of unhedged exposure. Across five positions priced against stale carry signals in a single active session, the aggregate unhedged exposure can exceed the total daily risk budget for a mid-market trading operation.
How LME Carry Curve Pricing Breaks Compound Across a Metals Book
The scenarios above describe single-position breaks. The operational reality in a metals trading book is that carry signals power multiple simultaneous pricing workflows.
A base metals desk typically prices physical premiums, rolls nearby positions, and marks forward book value, all referencing the same carry curve signal. When that signal is stale, the contamination is not confined to one deal. Every pricing decision made within the same refresh window inherits the same carry error at the same magnitude.
LME warehouse inventory data shows that stock movements, a primary driver of nearby spread tightening, can shift by 5,000 to 10,000 tonnes in a single morning reporting cycle. LME daily warehouse inventory reports A large drawdown published at 09:00 LME time can begin moving the cash premium within minutes of the report. A desk refreshing carry signals every 4 minutes may price two or three deals before the updated carry level appears on their screen.
The second-order effect is mark-to-market contamination. End-of-day P&L calculations that apply the same stale carry signals used for live deal pricing will misstate position value. The daily MTM report tells risk managers a different story from the one the market wrote during the session. Risk limits are monitored against the wrong numbers. Escalation thresholds are calibrated to a position book that does not reflect what actually happened.
This is the full propagation path of a carry curve pricing break: a single stale signal at the moment of pricing creates a chain of downstream errors that persists through reconciliation, MTM, risk reporting, and ultimately P&L attribution. The originating cause (a batch refresh interval measured in minutes) is typically invisible in post-trade analysis, which attributes the variance to spread movement rather than data architecture.
What Tick-Level LME Carry Curve Intelligence Actually Looks Like
A platform built on daily batch workflows cannot be retrofitted to deliver tick-level carry intelligence. The data ingestion pipeline, normalization layer, and display infrastructure all need to operate at market speed for carry signals to be actionable. Adjusting refresh settings on a batch architecture accelerates the polling cycle; it does not change the fundamental latency model.
Novaex is built specifically for this operating environment. The platform ingests LME carry curve data at the tick level rather than on a scheduled refresh cycle. This means the C3 spread, TOM/NEXT values, and full prompt date structure visible on the Novaex interface are current to the last market transaction instead of the last batch process. This distinction is fundamentally architectural.
For the three named pricing break scenarios, tick-level carry visibility changes the operational outcome directly:
- Stale Carry Hedge: Eliminated. The carry differential used to price a physical forward reflects live market structure at the moment of pricing, not a snapshot from minutes earlier.
- Unreconciled TOM/NEXT Roll: Eliminated. The roll cost displayed at execution matches the spread market at execution time. Reconciliation is immediate rather than deferred to the next batch cycle.
- Backwardation Squeeze Mid-Session: Managed rather than discovered. When backwardation sharpens, the move is visible in real time. A trader sees the cash premium widen, can reprice accordingly, and adjusts hedging strategy before executing into a dislocated carry structure.
For mid-market metals operations, the practical consequence is direct: tick-level carry intelligence is no longer exclusively accessible to tier-one banks with proprietary data infrastructure. Novaex delivers the same carry curve resolution at a price point accessible to physical trading firms, merchant houses, and mid-market industrial hedgers operating on the LME. According to Gartner's research on commodity software adoption, mid-market trading firms that upgrade to real-time data infrastructure reduce unexplained P&L variance by 15 to 30% within the first two quarters of deployment. Gartner commodity technology adoption research
The Carry Break Is Already in Your Book
Contango-to-backwardation transitions on the LME are not rare events reserved for crisis markets. They happen in copper during inventory draws, in aluminum during demand spikes, and in nickel, as the 2022 LME nickel crisis demonstrated, with a speed and magnitude that renders any refresh rate measured in minutes operationally dangerous before the first ring session closes. 2022 LME nickel market disruption and carry dynamics
The mechanism behind every pricing break is the same: a carry signal aged by a batch refresh cycle being used to make decisions in a market that has already moved. The gap between those two states, measured in ticks rather than abstractions, is where your unexplained P&L variance originates.
Three concrete steps to take now:
- Map your current refresh rate. Identify the actual interval at which your CTRM updates C3 spread and TOM/NEXT values. Look for the actual latency from market event to screen display rather than the theoretical polling rate.
- Apply the error model to your book. At your typical carry velocity and your standard position size, calculate the maximum per-tonne pricing error embedded in a single pricing decision made against a stale carry signal.
- Trace the propagation path. Identify how many pricing decisions in a typical session reference the same carry signal within a single refresh window, and what the aggregate unhedged exposure looks like if that signal is wrong.
To see tick-level LME carry curve intelligence applied to a live metals book, Novaex platform demo request request a Novaex walkthrough. We will demonstrate the carry curve interface under real market conditions, including contango, backwardation, and the transitions between them where pricing breaks occur.