LME Week 2026: What the Room Was Really Talking About
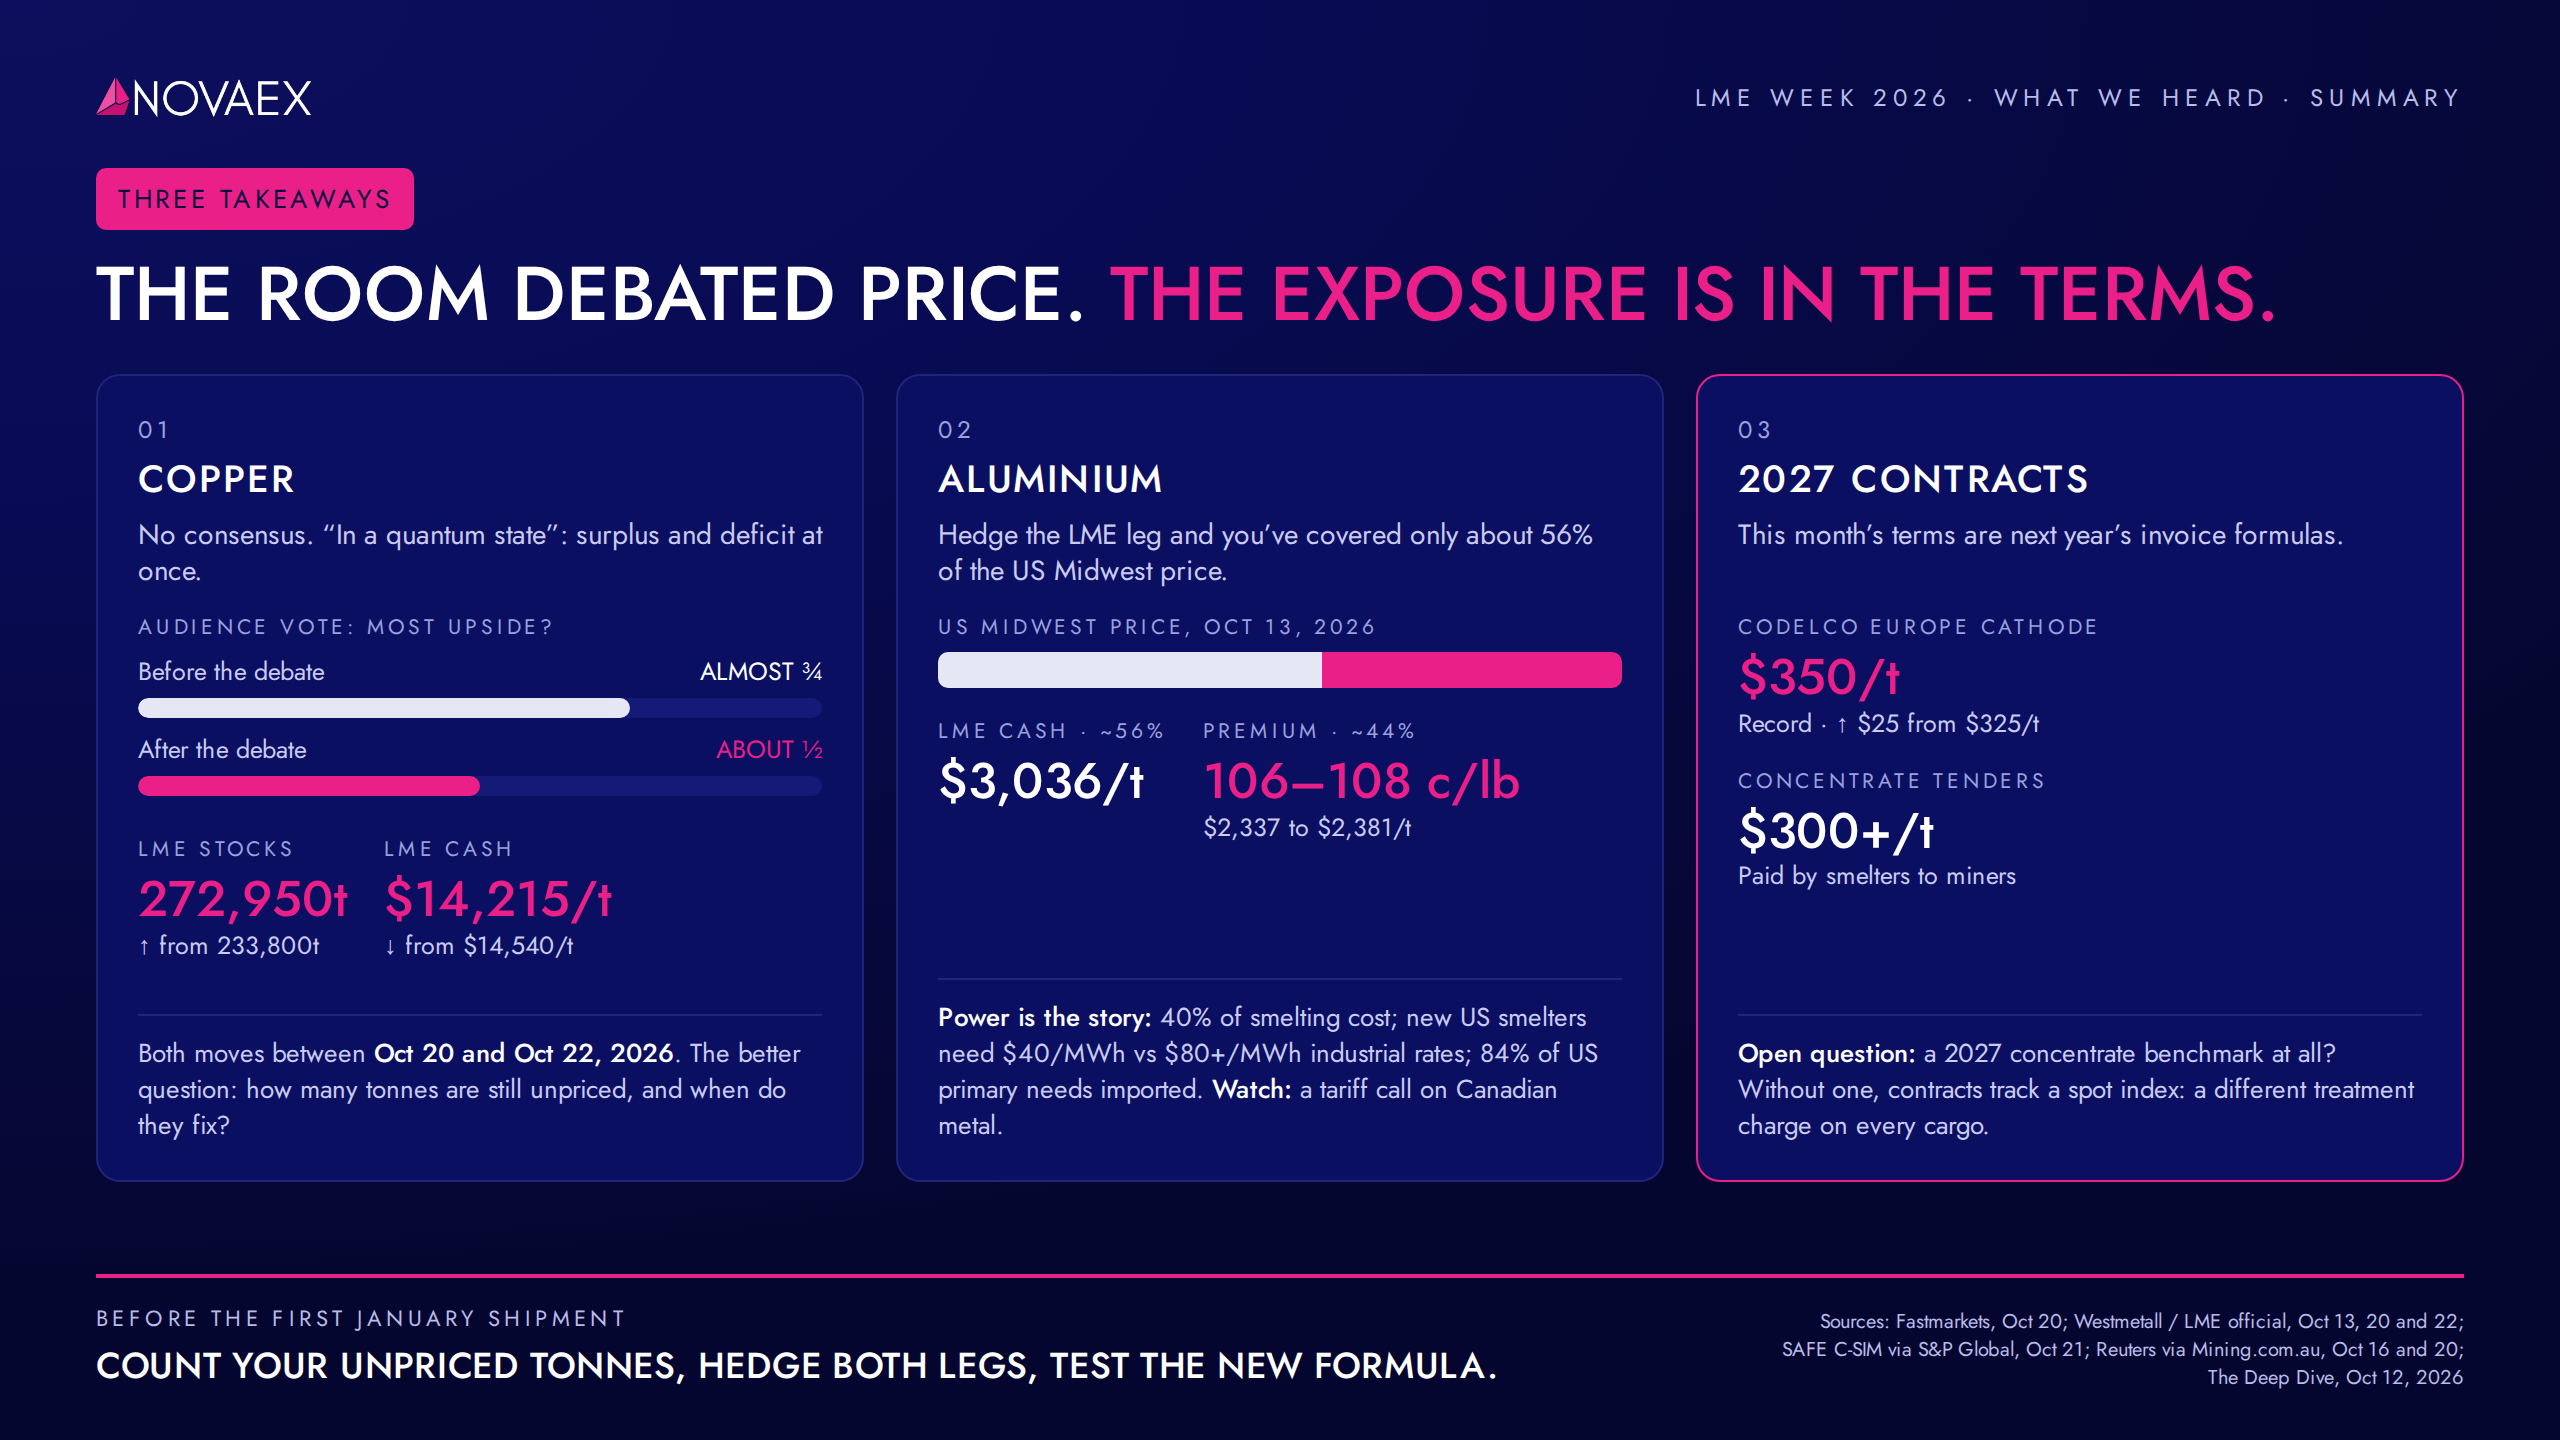
Copper went into the LME Week debate with almost three-quarters of the room voting it the metal with the most upside. It came out with about half.
That split stayed with us through every meeting and dinner that followed. The NOVAEX team spent the week in London, and we expected a week of price calls. Instead, the real conversation was about contract terms and where the risk sits.
This post covers three takeaways: copper's divided outlook, aluminium's power cost problem in North America, and the 2027 contract terms being written right now. For each one, we show the numbers and what a desk can do with them before the first January shipment.
Why LME Week 2026 Was About Contract Terms, Not Price Calls
Most years, the headline output of LME Week is a set of price forecasts. This year, the forecasts cancelled each other out. When half the room sees upside and the other half doesn't, a price call is a coin toss, and conversations move to what you can still control.
That meant three things kept coming up:
- Exposure: how many tonnes are still unpriced, and when they fix
- Premiums: how much of the all-in price sits outside the LME leg, and outside the hedge
- Formulas: which treatment charge and premium terms go into 2027 contracts, and whether systems can calculate them
Copper: Nobody Agrees, and the Data Isn't Settling It
A Market "in a Quantum State"
One panellist described copper as being "in a quantum state": in surplus and in deficit at the same time. Both cases have support. Concentrate tightness and long-term electrification demand point to deficit. Rising visible stocks and softer near-term demand point to surplus. The vote in the room reflected that: a market that started the week with a clear consensus ended it split down the middle.
What the Warehouse Data Showed
The data during the week didn't resolve the debate. Between October 20 and October 22:
| Indicator | Oct 20 | Oct 22 | Change |
|---|---|---|---|
| LME copper stocks | 233,800 t | 272,950 t | +39,150 t (+16.7%) |
| LME copper cash settlement | $14,540/t | $14,215/t | −$325/t (−2.2%) |
A 17% stock build in two sessions is a surplus signal. A cash price still above $14,000/t is not a surplus price. Both readings can be argued, which is exactly the problem. LME Live Prices
The Better Question: How Many Tonnes Are Still Unpriced?
When the room is this divided, the better question for most desks is not where copper goes next. It is how many tonnes are still unpriced, and when those fix.
A $325/t move in two sessions is a useful stress figure. On 5,000 t of open, unpriced exposure, that move is worth about $1.6 million. Whether it lands as a gain or a loss depends on the direction of your position, not on whose forecast was right.
Aluminium: North American Buyers Kept Bringing Up Power
Why the US Smelter Math Doesn't Work
Electricity accounts for roughly 40% of the cost of making primary aluminium. A new US smelter needs power contracted for decades at close to $40/MWh to be competitive. US industrial power rates currently sit above $80/MWh.
At twice the required power price, new US primary capacity doesn't get built. As a result, the US imports about 84% of the primary aluminium it uses, and the Midwest premium carries the cost of moving that metal into the country.
The Premium Is Now Most of the Story
On October 13, the Midwest premium traded at 106 to 108 cents/lb. LME cash settled at $3,036/t the same day.
| Component (Oct 13) | $/t | Share of all-in price |
|---|---|---|
| LME cash | $3,036 | ~56% |
| Midwest premium (~107 c/lb) | ~$2,359 | ~44% |
| LME plus premium | ~$5,395 | 100% |
The premium was worth more than three-quarters of the LME price. A buyer who hedges only the LME leg has covered about 56% of their actual delivered price. The other 44% is open. Hedging Guide
What Could Move the Unhedged Part
The premium is driven by import costs, and tariffs are the largest import cost. A tariff decision on Canadian metal could move the premium sharply in either direction.
For scale: a 10 cents/lb move in the premium is about $220/t. On 1,000 t of monthly purchases, that is $220,000 a month sitting outside an LME-only hedge.
2027 Contracts Are Being Written Now
Record Copper Premiums for Europe
Codelco is reportedly offering European buyers a record $350/t copper premium for 2027, up from $325/t for 2026. The $25/t increase looks small per tonne. On a 10,000 t annual contract, it adds $250,000 to the year's cost before any change in the LME price.
Treatment Charges Below Zero
On concentrates, the picture is more unusual. Spot treatment charges are deeply negative: in recent tenders, smelters paid miners more than $300/t to secure concentrate, reversing the normal direction of payment.
People in London were openly asking whether an annual treatment charge benchmark gets agreed for 2027 at all. Without one, contracts track a spot index, and every cargo carries a different charge.
The Formula on Next Year's Invoices
Whatever gets signed this month becomes the formula on next year's invoices. That has a practical consequence. A fixed annual benchmark is one number entered once. A spot-indexed charge is a calculation that runs on every cargo, with its own pricing period, index source, and adjustment terms.
If that formula isn't built into your system and tested before the first January shipment, the first invoice is where you find out.
Quantifying What's Still Open
The three takeaways share a pattern: the exposure is real, it is measurable, and it often sits outside the standard LME hedge. Using the figures above as illustrative inputs:
| Exposure | Driver | Illustrative size | Illustrative impact |
|---|---|---|---|
| Unpriced copper | $325/t two-session move | 5,000 t | ~$1.6M |
| Unhedged Midwest premium | 10 c/lb premium move | 1,000 t/month | ~$220k/month |
| 2027 European copper premium | +$25/t year on year | 10,000 t/year | +$250k/year |
None of these numbers require a view on where prices go. They only require knowing your own tonnes.
How to Run a Pre-2027 Exposure Check on Your Own Book
Each step can be done with data your desk already has.
Step 1: Count your unpriced tonnes. List every open copper, aluminium and zinc position that hasn't fixed, with its pricing date. Group them by month so you can see where fixing risk clusters.
Step 2: Split the all-in price into its legs. For each metal, separate the exchange price from the regional premium. Note which legs are hedged and which aren't. For US aluminium buyers, this usually shows the premium leg as the largest open exposure.
Step 3: Review the 2027 terms under negotiation. For each contract, record the premium, the treatment charge basis (benchmark or spot index), the index source, and the pricing period.
Step 4: Test the formulas before January. Run a sample invoice for each new contract through your system using current index values. If the output doesn't match a manual calculation, fix it now, not after the first shipment.
Fields to Check
The minimum check covers these fields per contract:
- Unpriced tonnes and fixing dates: the size and timing of open price risk
- Exchange leg vs. premium leg: how much of the delivered price the hedge actually covers
- Premium level and change vs. 2026: the year-on-year cost increase
- Treatment charge basis: annual benchmark or spot index
- Index source and pricing period: what each cargo's charge will be calculated from
- System test result: whether a sample invoice calculates correctly
Let's Pick Up the Conversation
We went to London expecting a week of price calls. We came back with notes on contract terms, premium exposure, and who carries which risk into 2027.
We didn't get to everyone. If we missed you in London, or the dinner ended before the conversation did, we'd like to continue it.
Booking Link