Modeling 90-Day Position Break Exposure: Metals Desk
A position break serves as an exposure window that opens the moment a discrepancy appears and closes only when reconciliation is confirmed. On a metals desk running manual workflows, that window averages three to four business days [metals desk reconciliation workflows](). Firms must evaluate how much aggregate notional transits through unreconciled states before the quarter ends.
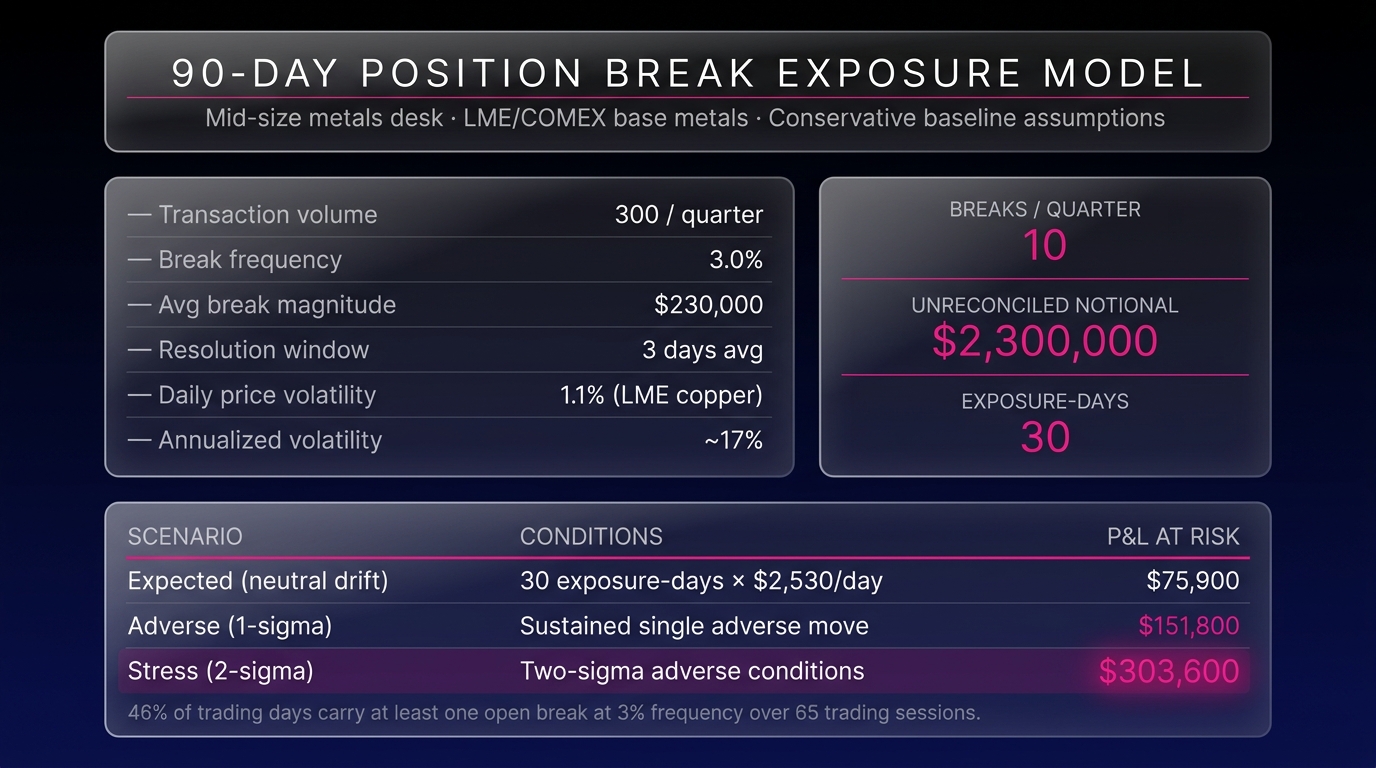
A mid-size metals desk executing approximately 300 transactions per quarter at a conservative 3% position break rate generates around 10 breaks over ninety days. At one standard LME contract unit per break and a three-day average resolution window, aggregate notional transacted through unreconciled states exceeds $2.3 million per quarter before any adjustment for adverse price movement during open windows.
The model that follows states all assumptions explicitly. Every figure is deliberately conservative; the objective is to provide a metals desk with a reproducible framework it can test against its own transaction log.
What Position Break Exposure Means for a Metals Desk
Defining Position Breaks in Commodity Trading
A position break occurs when a firm's internal book of record shows a position that does not match what a counterparty, clearinghouse, or executing broker reports for the same trade. In physical metals operations, breaks also arise when booked inventory diverges from warehouse receipt data or exchange warrants. The break represents an information gap. These gaps in a live hedged book mean the desk cannot confirm whether it is actually hedged.
This distinction matters operationally. A break does not merely create administrative work. It creates a period during which the desk's risk position is structurally uncertain, and decisions made against that uncertain book carry unquantified exposure.
Across LME, COMEX, and SHFE derivative positions, a single lot discrepancy represents meaningful notional. An LME copper contract covers 25 metric tons; at approximately $9,200 per metric ton LME copper current pricing, that is $230,000 in notional value per standard contract. An unconfirmed lot acts as a quarter of a million dollars operating outside the confirmed hedge book.
The 90-Day Exposure Model: Stated Assumptions
Every quantitative model is only as credible as its assumptions. The following parameters are stated explicitly and err toward conservative estimates. A metals desk with different operational characteristics should substitute its own figures at each variable.
Position Break Frequency on a Metals Desk
Industry operational benchmarks for commodity trading desks running manual or semi-automated reconciliation report position break rates between 3% and 7% of transaction volume commodity operations reconciliation benchmarks. This model uses 3% (the low end of that range) to establish a conservative baseline. Breaks arise from trade booking errors, counterparty confirmation discrepancies, exchange give-up processing delays, and warrant mismatches in physical positions. No single cause dominates; the 3% rate reflects a steady-state background frequency rather than exceptional circumstances.
Model Parameter 1: Break Frequency: 3% of transactions. Conservative; operational environments relying on manual matching cycles often exceed this rate.
Manual Resolution Timeframes
For derivative position breaks at LME or COMEX, confirmation matching cycles and broker response times typically produce a three-to-five business day resolution window under manual processes, according to operational risk assessments of commodity trading workflows commodity trade operations workflow analysis. Physical position breaks (involving warrant discrepancies or warehouse inventory) can run longer, sometimes exceeding a week when storage facility coordination is required.
Model Parameter 2: Resolution Window: 3 business days average. Physical breaks are excluded from this baseline to maintain a tractable, conservative calculation.
Model Parameter 3: Desk Size: 3 traders managing mixed LME and COMEX base metals (copper, aluminum, and zinc). Quarterly transaction volume: 300 transactions, reflecting outright trades, hedge overlays, and roll transactions combined.
Model Parameter 4: Average Break Magnitude: One standard LME contract unit (25MT copper equivalent, approximately $230,000 notional at $9,200/MT). Breaks involving partial lots or smaller-notional contracts will produce lower figures.
Model Parameter 5: Daily Price Volatility: 1.1% per day for LME copper, consistent with a 90-day historical annualized volatility of approximately 17% LME copper volatility data. This figure is applied to calculate directional P&L exposure during open break windows.
Running the Numbers: Cumulative Exposure on a Mid-Size Metals Desk
With assumptions stated, the calculation runs in three steps.
Step 1: Expected break count over 90 days:
300 transactions × 3% break rate = 10 position breaks per quarter.
This represents the absolute minimum. At the industry median break rate of 5%, the same desk generates 15 breaks over the same period.
Step 2: Aggregate notional transacted through unreconciled states:
10 breaks × $230,000 average break magnitude = $2.3 million in aggregate unreconciled notional over 90 days.
This figure represents the total notional that passed through a period of positional uncertainty. It indicates the cumulative scale of the desk's exposure windows during the quarter rather than an immediate trading loss.
Step 3: Exposure-day calculation and expected P&L at risk:
Each break creates a defined exposure window. With 10 breaks and a 3-day average resolution window, the model generates 30 exposure-days across the quarter, representing 30 days during which the desk held notional that was unconfirmed in its hedge book.
Daily P&L at risk per open break: $230,000 × 1.1% daily volatility = $2,530 per day.
Expected cumulative P&L impact across all 30 exposure-days: 30 × $2,530 = $75,900.
This represents the expected value under neutral drift as a statistical mean. Under a sustained single adverse one-sigma move across open windows, the figure reaches approximately $151,800. Under two-sigma conditions, it approaches $303,600.
To state this plainly: these are the P&L values at risk during periods when the desk's position cannot be confirmed. Whether that risk materializes depends on market movement during each specific break window. No reconciliation process controls this variable.
Calculating Financial Exposure
The financial exposure from an unreconciled position equals the break magnitude multiplied by daily price volatility multiplied by the number of days the break remains open. On a standard LME copper contract at current prices and historical volatility, each day of open break status carries approximately $2,500 in directional P&L exposure. Over three days, that reaches $7,500 per break at expected drift, before accounting for basis risk, bid-ask slippage on corrective trades, or margin implications at the clearing level.
The exposure is not symmetric. A break that leaves the book with an unintended long position benefits from upward moves and loses on downward moves; a break producing an unintended short does the reverse. The desk does not know which condition it is in until the break is resolved. This uncertainty is the core risk the model measures.
According to a 2022 industry review of commodity trading operational risk, position-level reconciliation failures accounted for a disproportionate share of unplanned P&L variance in physical and derivative metals books, with individual events ranging from negligible to material depending on market timing commodity trading operational risk review. Timing determines severity alongside frequency, rendering a pure frequency-based model insufficient as a standalone measure.
Why Position Break Exposure on a Metals Desk Compounds Over Time
Individual breaks are episodic. The pattern across a full quarter is structural.
A desk running at 3% break frequency experiences a recurring state in which some portion of its book consistently sits in an unreconciled status. The size of that concurrent exposure depends on how quickly breaks are resolved relative to how quickly new ones are generated.
With 10 breaks over 65 trading days and a 3-day average resolution time, the desk carries an open break on approximately 46% of trading days during the quarter. Nearly half of all trading days include at least one unresolved position discrepancy somewhere in the book.
According to research on hedge effectiveness in commodity portfolios, even small discrepancies between booked and actual positions can introduce unintended basis exposure that persists across multiple hedge roll cycles commodity hedge effectiveness research. A break that spans a futures roll date carries spot price risk and misaligns roll exposure, affecting carry P&L in ways hidden from the headline break figure.
The 90-day model deliberately excludes these second-order effects. The $75,900 expected P&L at risk figure acts as a floor for exactly this reason.
Realized Trading Losses from Position Breaks
Position breaks frequently cause realized losses, though the mechanism varies by break type. The most direct path is a break that leaves a hedged physical position temporarily unhedged: if prices move adversely during the break window, the loss is realized when the corrective trade executes. A second path involves inadvertent double-counting. A break that causes the same position to appear twice in the book may trigger an unnecessary hedge transaction, generating realized transaction costs and potential re-hedging slippage that are entirely avoidable.
The model above captures only the first mechanism. Transaction cost exposure from corrective trades is excluded from the conservative base case, which means the $75,900 figure understates full-cost exposure by a measurable margin.
What the 90-Day Exposure Model Does Not Capture
The framework intentionally excludes the following exposure categories because analyzing them requires desk-specific data.
Excluded factors:
- Basis risk during open breaks. LME and COMEX positions carry different basis profiles. A break involving a COMEX position hedging an LME-priced physical exposure introduces cross-exchange basis risk during the open window (unmeasured in this model).
- Regulatory and counterparty reporting obligations. Under EMIR and CFTC reporting frameworks, position discrepancies may create reporting inconsistencies with material compliance implications EMIR derivative reporting requirements. These carry costs independent of market movement and independent of whether the break ever produces a P&L event.
- Management time and operational drag. Industry estimates for manual break investigation and resolution in complex commodity position environments run two to four hours per event commodity operations efficiency benchmarks. At 10 breaks per quarter, that is 20 to 40 hours of front- and back-office time. This represents a real operational cost excluded from the pure P&L calculation.
- Physical delivery risk. For desks managing LME warrants or physical inventory positions, a break that spans a delivery window carries potential for failed delivery or unintended acceptance, with associated costs that can significantly exceed the derivative equivalent.
The Reconciliation Process as a Risk Management Variable
Position break frequency operates as a direct function of workflow design, specifically the speed and completeness of the matching cycle.
Automated reconciliation systems that match trades in real time against exchange data, broker confirms, and counterparty records reduce break frequency by detecting discrepancies before they become operational events. According to a 2021 analysis of commodity trading operations efficiency, firms that implemented automated position reconciliation reduced exception rates by 60 to 75% compared to manual-cycle workflows commodity operations automation research.
Applying a 60% reduction to this model: 10 breaks become 4. Aggregate unreconciled notional drops from $2.3 million to $920,000. Exposure-days fall from 30 to 12. Expected P&L at risk falls from $75,900 to approximately $30,360.
These figures result directly from applying published reduction rates to the conservative base-case assumptions already stated. The reduction driver is detection speed: catching a break within minutes compresses the exposure window to near-zero before market movement has time to act on it.
Reconciliation frequency also determines hedge confirmation latency. How long a position break remains open governs how many days of directional exposure accumulate before the desk can confirm its hedge status. A daily reconciliation cycle that detects a break on day one still leaves three days of exposure if resolution requires counterparty coordination. Intraday detection that escalates a break within hours compresses that window to a fraction of the daily exposure calculation. The difference fundamentally dictates the size of the exposure-days figure that accumulates in the quarterly model.
According to Gartner research on operational risk visibility in financial services, the majority of operational risk events in trading environments go unmeasured until they produce a realized loss, at which point attribution becomes difficult and prevention is retrospective Gartner operational risk visibility financial services. The 90-day model is structured specifically to make that measurement prospective.
Process Visibility and Measurement
The model above uses one specific set of parameters. It is built for reproduction rather than passive reading.
A metals desk that wants to test this framework against its own operations needs four numbers from its own trade log:
- Transaction volume over the last 90 days
- Number of confirmed position breaks over the same period
- Average break magnitude in notional terms
- Average days-to-resolution for identified breaks
That number is either visible in your current reconciliation workflow (captured, tracked, and reported to risk management on a recurring basis) or it remains hidden.
If it is visible, your current process is performing a function that most manual-reconciliation environments do not perform. Without this visibility, the $2.3 million in aggregate unreconciled notional identified for a conservative mid-size desk becomes a description of what already happened last quarter, completely unmeasured.
Model assumptions summary: 3-trader LME/COMEX base metals desk (copper, aluminum, zinc); 300 transactions per quarter; 3% position break frequency (conservative; published industry range: 3, 7% for manual reconciliation environments); $230,000 average break magnitude (one standard LME copper contract equivalent at $9,200/MT); 3-day average manual resolution window; 1.1% daily LME copper price volatility (17% annualized, 90-day historical basis). Second-order effects (including cross-exchange basis risk, regulatory reporting exposure, management time costs, and physical delivery risk) are excluded from the base-case calculation. All dollar figures are illustrative model outputs, rather than projections of actual losses.