Spreadsheet Risk in Metals Trading: A Workflow Audit
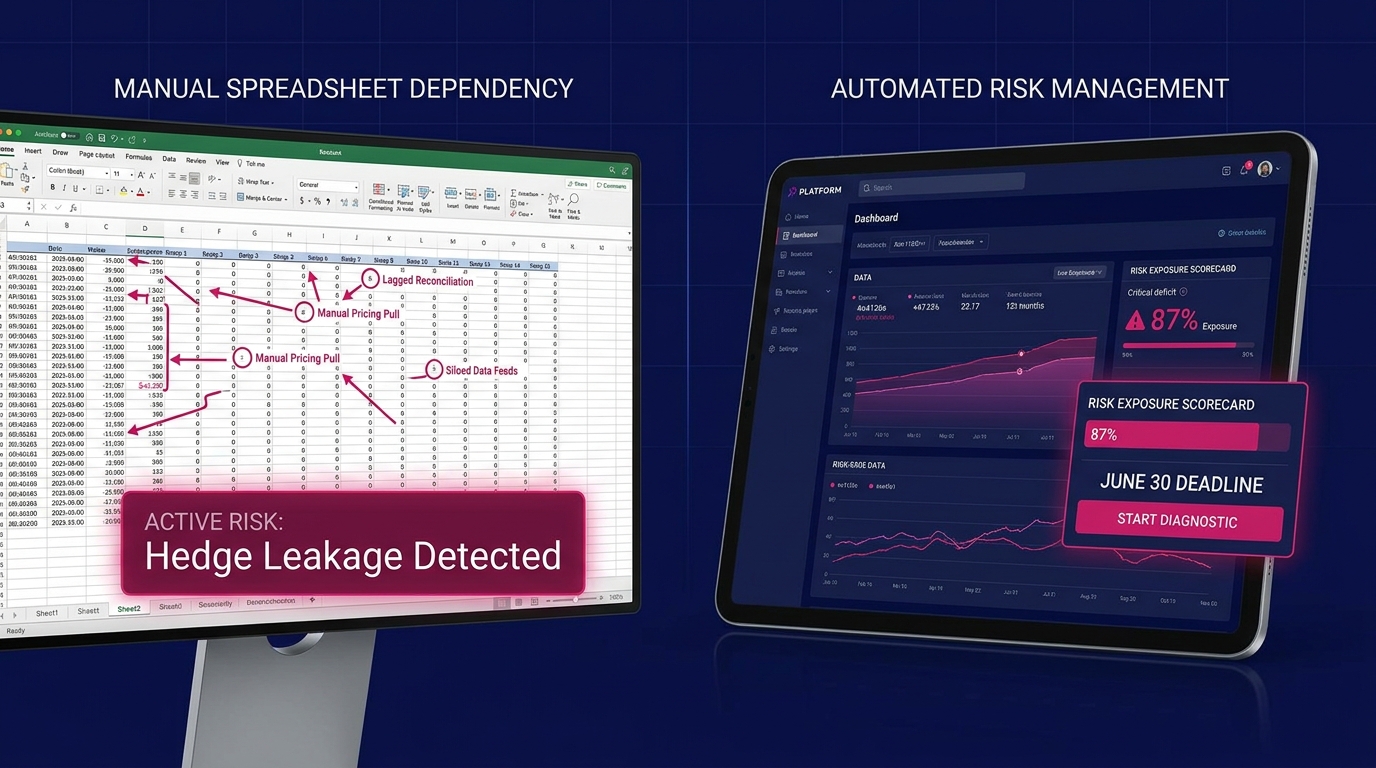
If your pricing data requires a manual pull before you can act, you are already operating with a structural lag. Metals trading spreadsheet risk concentrates in three measurable workflow points: manual pricing pulls that introduce latency during fast markets, lagged position reconciliation that obscures real-time exposure, and siloed exchange data feeds that fragment LME, COMEX, MCX, and SHFE visibility into disconnected snapshots. This audit helps you confirm whether these risks are active in your operation.
At which specific point in your workflow does the process break under market pressure? For most metals trading operations relying on spreadsheet infrastructure, the evidence is already embedded in the process. The question is where.
Work through each indicator below. Note where your operation sits.
Why Metals Trading Spreadsheet Risk Is a Structural Problem
The word "spreadsheet" in a trading context has become nearly synonymous with "manual process risk." According to research published by the European Spreadsheet Risks Interest Group (EuSpRIG), 88% of spreadsheets in active business use contain at least one material error EuSpRIG spreadsheet error research. In commodity trading environments, these errors do not stay abstract. They propagate directly into position calculations, hedge ratios, and intraday P&L reports.
For base metals traders specifically, spreadsheet dependency compounds because the underlying market structure is inherently multi-venue. A copper position may carry simultaneous exposure across the LME three-month contract, a COMEX futures hedge, and physical pricing indexed to the MCX. Reconciling these positions manually (even with well-designed spreadsheet infrastructure) introduces latency at every joint in the process.
A 2023 operational risk survey by Accenture found that commodity trading firms spending more than 40% of front-office time on manual data consolidation reported significantly higher incidence of pricing errors during high-volatility sessions Accenture commodity trading operations report. The surveyed firms were not outliers. They represented the median condition across mid-market trading desks.
Spreadsheets are powerful analytical tools, but they create a mismatch between tool design and workflow demand when that demand includes real-time multi-exchange position visibility under active market pressure.
Is spreadsheet-based trading still viable for metals desks?
Spreadsheet-based trading remains viable for operations with limited exchange exposure, low transaction frequency, and minimal multi-venue complexity. For a metals desk managing positions across two or more exchanges with intraday pricing requirements, that viability window closes quickly. The critical threshold occurs when manual refresh cadence cannot keep pace with the pricing movement that triggers a hedge decision.
Diagnostic Indicator 1: Manual Pricing Pulls and Metals Trading Spreadsheet Risk
Manual pricing pulls are defined here as any workflow step requiring a trader or analyst to retrieve current pricing data from an external source (a broker terminal, exchange website, or market data vendor feed) before updating a working position spreadsheet.
The latency this introduces is not incidental. During normal market conditions, a 5, 15 minute pricing lag may be operationally tolerable. During LME ring trading, MCX settlement windows, or a COMEX open-hour spike, that same lag becomes a pricing error in waiting, confirmed only by the next trade execution.
According to data published by the LME, base metal prices can move more than 2, 3% within a single five-minute window during high-volatility sessions LME market data and volatility statistics. At that magnitude, any manually-refreshed price feed is directionally unreliable for active hedge decisions from the moment it is entered.
The latency problem is asymmetric. A trader operating on a correct but delayed price does not know the price is delayed. The error is invisible until it is confirmed by a fill, a mark-to-market, or a day-end reconciliation that no longer matches the position the trader believed they held.
Self-assessment checkpoint:
- Does your desk have a defined, enforced cadence for how frequently pricing data is refreshed during active trading hours?
- If a trader needs the current three-month copper offer right now, does producing that number require a manual action?
- When was the last time a trade was executed (or a hedge was deferred) on a price that was later confirmed to be stale?
How does manual pricing create hedging errors in metals trading?
Manual pricing creates hedging errors when the price used to calculate a hedge ratio or exposure limit is not synchronized with the market at the moment of execution. The wider the time delta between data refresh and trade decision, the higher the probability that hedge quantum is miscalculated. In a fast LME or COMEX session, this delta can transform a correctly-structured hedge strategy into a structurally over- or under-hedged position in minutes, without any actor in the workflow making an error of judgment.
Diagnostic Indicator 2: Lagged Position Reconciliation
Lagged position reconciliation describes any workflow in which the current net exposure (across physical inventory, forward contracts, exchange-traded futures, and OTC derivatives) is not available in a single, real-time consolidated view.
Most metals trading operations do not have a unified position view. They have multiple partial views: a broker statement reconciled daily, a physical inventory updated by operations on its own schedule, a futures ladder maintained in a separate workbook. The consolidated picture exists only when someone constructs it, typically at day end, or under market pressure, or both.
A 2022 study by McKinsey & Company on commodity trading risk infrastructure found that organizations using siloed or semi-manual position reconciliation workflows experienced an average delay of 4, 6 hours between a confirmed position change and verified consolidated exposure visibility McKinsey commodity trading risk infrastructure. For a metals desk managing multi-exchange exposure, 4, 6 hours is not a reporting delay. It is a risk management gap that spans multiple LME sessions and an entire MCX trading day.
Accuracy at day end is standard practice. The true test is whether reconciliation is complete during market hours, under active price movement, at the exact moment a decision must be made.
Self-assessment checkpoint:
- If you needed your consolidated net copper exposure (physical plus futures plus OTC) right now, as a single number, how long would it take to produce?
- Does your position reconciliation require any manual data transfer step between systems: copy-paste, export and import, or manual re-entry from one format to another?
- Have you discovered a position discrepancy only after completing a day-end reconciliation?
What is the real risk of delayed position reconciliation?
Delayed position reconciliation creates exposure invisibility. This is the gap between what a trader believes the net position to be and what it actually is at any given moment. In a multi-exchange metals portfolio, this gap can produce duplicate hedging, unintended directional exposure, or breach of internal risk limits before the breach registers. The 2012 JPMorgan "London Whale" loss (while not a metals operation) demonstrated at institutional scale how position invisibility in a complex derivatives book compounds faster than manual reconciliation can track JPMorgan London Whale case study and risk management analysis.
Diagnostic Indicator 3: Siloed Exchange Data Feeds
Siloed exchange data feeds describe the condition in which market data from LME, COMEX, MCX, and SHFE arrives through separate channels (different vendor terminals, different data subscriptions, different update frequencies) without normalization into a unified pricing and position framework.
This is the default infrastructure condition for most metals trading operations that have grown over time. Each exchange feed was added as the operation expanded its market footprint. The result is a patchwork of data sources that never agreed on a common format, a common update cadence, or a shared methodology for inter-exchange spread calculation.
According to a 2023 Commodity Markets Council survey, more than 60% of mid-market commodity trading firms rely on three or more separate data vendor relationships for exchange price data, with no automated normalization layer connecting them Commodity Markets Council commodity data infrastructure report. The operational consequence is direct: any cross-venue analysis (LME/COMEX copper spread, SHFE aluminum premium, MCX zinc basis) must be manually constructed from separately-sourced, unsynchronized data points.
While most commercial exchange data feeds are technically reliable individually, accuracy within each feed does not automatically produce accuracy across feeds when the feeds are temporally misaligned and structurally disconnected.
Self-assessment checkpoint:
- Do your LME, COMEX, MCX, and SHFE price feeds arrive in separate interfaces, requiring manual tabulation before a cross-exchange spread can be calculated?
- Is your inter-exchange basis calculation built manually in a spreadsheet from separately-sourced data points?
- When SHFE closes and LME opens, does your overnight position carry forward with an updated cross-venue exposure view, or does it wait for a manual reconciliation step at the start of the London session?
How do siloed data feeds affect metals basis risk management?
Siloed exchange data feeds prevent accurate basis risk management because basis (the price differential between a physical delivery market and an exchange-traded futures contract) requires simultaneous, normalized pricing across venues to calculate correctly. When LME and COMEX copper prices are sourced from different feeds refreshing at different rates, the basis calculation carries a temporal error that grows during volatile periods. For physical metals traders managing delivery obligations against forward hedges, this creates a systematic bias embedded in the hedge effectiveness calculation itself.
The Exchange Exposure Grid: Mapping Spreadsheet Risk Across Venues
The four-exchange footprint (LME, COMEX, MCX, SHFE) is not merely a geographic consideration. Each exchange operates under a distinct contract specification, settlement methodology, and liquidity profile. A metals operation carrying exposure across all four is managing four structurally different risk instruments, each requiring its own pricing logic and reconciliation pathway.
Read the grid below as a diagnostic instrument. For each row, the operative question is: does your current infrastructure provide real-time, normalized data for this exposure type during that exchange's active session?
| Exchange | Contract Type | Settlement Methodology | Peak Liquidity Window | Spreadsheet Lag Risk |
|---|---|---|---|---|
| LME | Rolling 3-month + prompt dates | LME Official Price (ring) | 11:40, 13:00 / 14:50, 17:00 GMT | High: ring session volatility compresses decision windows |
| COMEX | Monthly futures | Daily settlement price | 08:00, 13:30 ET | High: open and close volatility concentrated in 30-minute windows |
| MCX | Monthly futures | MCX settlement price | 09:00, 23:30 IST | Moderate: afternoon session spikes during overlap with LME |
| SHFE | Monthly futures | Settlement price | 09:00, 15:00 CST | High: overnight gap risk for Western desks; position updates cross sessions |
If your operation has active exposure in more than two cells of this grid and is managing it through manual pricing and reconciliation infrastructure, the composite spreadsheet lag risk compounds multiplicatively.
An error introduced at the LME pricing level propagates into the cross-exchange spread calculation. The spread error propagates into the basis figure. The basis error propagates into the hedge ratio. By the time the chain reaches a trade decision, the original five-minute pricing lag has been amplified through every downstream calculation it fed.
According to the International Energy Agency's guidance on commodity market risk management, operational risk in multi-venue commodity positions is systematically underestimated when each venue is assessed in isolation rather than as an integrated exposure system [LINK: IEA commodity risk management guidance]. The grid above represents the complete exposure system. The question for your operation is whether your infrastructure treats it that way.
Scoring the Diagnostic: Operational Risk Tiers
Use this structural clarity instrument to review the three risk indicators against your confirmed workflow observations:
The Three Active Risk Indicators:
- Manual pricing pulls: Prices retrieved manually before use in trading or hedging decisions
- Lagged position reconciliation: Consolidated net exposure built at intervals rather than maintained continuously
- Siloed exchange data feeds: LME, COMEX, MCX, and SHFE data sourced and maintained separately, without a normalization layer
- One indicator confirmed active: Structural risk is present but bounded. Addressable with targeted process improvement within the current infrastructure envelope.
- Two indicators confirmed active: Structural risk carries interdependency. Pricing errors feed reconciliation errors; reconciliation errors feed exposure miscalculation. The risks compound. Process-level fixes applied to one indicator do not neutralize the others.
- Three indicators confirmed active: The operation is running on a manually-assembled risk picture during market hours. Every decision made under active price movement is made using structurally delayed, potentially error-compounded data.
The risk tier measures the gap between the complexity of the market exposure and the capability of the infrastructure managing it.
When should a metals trading operation upgrade from spreadsheet infrastructure?
A metals trading operation should evaluate infrastructure upgrade when any single active risk indicator (manual pricing, lagged reconciliation, or siloed feeds) can be linked to a specific trade decision error, a missed hedge window, or a confirmed position discrepancy. The critical threshold is the moment when a manual process introduces a confirmed error into a live trading decision, regardless of transaction volume or desk headcount. For most operations managing multi-exchange base metals exposure, that threshold is reached well before the operation recognizes it.
From Confirmed Risk to Structured Resolution
The purpose of this diagnostic is confirmation. Confirmation is only operationally useful if it opens a pathway to change.
These three risk indicators represent the precise failure modes that integrated commodity intelligence infrastructure is engineered to eliminate: real-time price feeds that remove manual pull latency, continuous position engines that replace interval reconciliation, and normalized multi-exchange data architectures that dissolve siloed feed dependency.
This standard requires a depth-first approach to market intelligence where each commodity's complete pricing, position, and risk picture is built to full fidelity before the platform expands its market scope. LME, COMEX, MCX, and SHFE function as one integrated exposure system that demands one integrated view.
According to a 2023 Oliver Wyman report on commodity trading technology transformation, firms that replaced manual front-office reconciliation with integrated position management platforms reduced intraday position error rates by 73% and recovered an average of 2.1 hours of analyst capacity per trading day Oliver Wyman commodity trading technology transformation report.
Three concrete next steps:
- Map your pricing latency. Time how long it takes from a confirmed market move to a verified updated position number in your active workflow. That duration is your current structural lag, quantified.
- Identify your reconciliation gap. Determine the longest interval between a confirmed position change and a confirmed consolidated exposure update during active market hours. That interval is your exposure invisibility window.
- Audit your exchange data architecture. List every data source feeding your current position model. Count the manual transfer steps between source and decision. Each step is a potential error injection point.
If your operation confirmed two or more active risk indicators in this audit, the infrastructure gap is structural. The next step is a platform assessment built around the depth-first standard: real-time, integrated, exchange-complete, and built by people who have traded base metals across these venues.
Novaex platform assessment request base metals position management platform overview