The Daily Cost of Metals Market Intelligence Gaps
Every metals desk operating four separate data feeds carries a cost that does not appear on any invoice. The daily cost of operating without consolidated metals market intelligence (LME, MCX, COMEX, and SHFE synthesized in a single real-time view) consistently runs to multiples of any platform subscription fee. That cost does not appear in billing. It appears in pricing decisions made on incomplete data at precisely the moments markets move fastest. This article builds the cost calculation from first principles. The methodology and supporting data are documented throughout.
Why Metals Market Intelligence Gaps Have a Measurable Price
In commodity trading, information gaps are commonly treated as operational friction, inconvenient but manageable. That framing is technically imprecise. Information gaps constitute financial exposure with a calculable daily value.
According to LME market microstructure data London Metal Exchange market microstructure analysis, bid-ask spreads on base metals contracts widen by 15, 40 basis points during high-volatility sessions. A trader entering or exiting a 500-lot copper position during a spread-widening event (one caused in part by incomplete cross-exchange visibility) absorbs that cost directly into P&L.
The problem is rarely the outright absence of data. Most trading desks subscribe to at least two or three data sources. The problem is fragmentation: data arriving from disconnected systems at different latencies, requiring manual synthesis before it can inform a decision. The synthesis gap is where the cost accumulates.
The Financial Impact of Data Fragmentation
Data fragmentation costs metals traders through three distinct channels: slippage from delayed execution, pricing errors from stale reference data, and opportunity cost from missed cross-exchange windows. According to a Accenture capital markets research 2022 Accenture Capital Markets study, firms operating with fragmented market data infrastructure spend an average of 23 additional minutes per trader per day on manual data reconciliation, before any trading decision is made. Across a five-trader desk, that represents nearly two hours of analytical capacity directed toward data management rather than market analysis.
That 23-minute figure does not account for decisions made during the reconciliation gap, before the cross-exchange picture has assembled itself. Those decisions carry their own embedded cost.
The Architecture of a Fragmented Metals Trading Desk
Understanding where cost accumulates requires mapping a typical fragmented workflow.
A front-office trader monitoring copper, aluminum, or zinc across all relevant venues is simultaneously tracking LME three-month contracts, MCX futures in Mumbai, COMEX front-month positions, and SHFE inventory data out of Shanghai. Each exchange operates in a different time zone, quotes in a different currency, and carries different settlement conventions.
Without consolidated metals market intelligence, the trader is performing currency conversion, time-zone-adjusted comparison, and cross-exchange spread analysis manually, or sequentially across tabs, terminals, and spreadsheets. According to [LINK: TABB Group commodity trading research] TABB Group's commodity trading infrastructure research, traders using fragmented data systems spend up to 31% of their analytical time on data normalization tasks rather than decision-making.
The Requirement for Consolidated Exchange Data
Metals traders need consolidated LME, MCX, COMEX, and SHFE data because each exchange captures a fundamentally different segment of global supply and demand, and pricing decisions based on one or two of these signals are structurally incomplete. LME warehousing data signals global inventory shifts; SHFE positioning reflects Chinese demand cycles; MCX spreads indicate South Asian physical premium dynamics; COMEX options positioning reveals institutional hedging intent. The cross-exchange relationship between SHFE inventory draws and LME cash-to-three-month spreads has historically preceded backwardation moves by 24 to 72 hours in copper, a signal that remains inaccessible when the data resides in separate systems. copper cross-exchange dynamics
No single exchange captures the complete picture. And the incomplete picture carries a quantifiable daily cost.
Building the Cost-of-Inaction Calculation
The cost of operating without consolidated cross-exchange metals market intelligence can be quantified across four components. Each is independently calculable. Their sum represents the daily inaction cost against which any subscription decision should be benchmarked.
Component 1: Execution Slippage from Delayed Synthesis
A trader requiring 8, 12 minutes to manually consolidate cross-exchange copper data before executing a hedge is not operating in the same market as a trader with a real-time consolidated view. According to [LINK: CME Group market data] CME Group market microstructure data, copper prices move an average of $12, 18 per tonne per minute during trend-initiation phases in the London-New York overlap session.
An 8-minute synthesis delay on a 200-tonne hedge translates to $2,400, $3,600 of potential execution slippage per trade. On a desk executing 5, 10 hedging transactions per week, the weekly slippage cost attributable to data fragmentation runs between $12,000 and $36,000. This range is conservative: it assumes no adverse directional movement during the synthesis window.
Component 2: Basis Risk from Incomplete Cross-Exchange Visibility
Physical metals traders hedging on the LME while counterparties price on MCX or COMEX carry basis risk. According to [LINK: commodity basis risk research] academic research on cross-exchange commodity basis dynamics, cross-venue basis volatility in copper has averaged 1.8, 2.4% of contract value during periods of elevated market stress since 2018.
A trader without real-time visibility into spread relationships across all four exchanges cannot actively manage that basis exposure. The cost settles into the mark-to-market, often undetected until it materializes.
Component 3: Opportunity Cost from Missed Arbitrage Windows
Cross-exchange arbitrage windows in base metals (LME/SHFE copper spreads, for example) frequently open and close in under 15 minutes. According to [LINK: LME SHFE arbitrage research] research on LME-SHFE copper arbitrage dynamics, qualified spread-trading opportunities arise an average of 3, 7 times per month in copper alone, with median durations under 20 minutes.
At average spread values of $15, 30 per tonne on a 500-tonne position, the opportunity cost per missed window runs $7,500, $15,000. A trader without simultaneous visibility across all four exchanges consistently enters late or misses the window entirely.
Component 4: Management Overhead from Manual Data Processes
The time cost is the most consistent and the most underestimated component. According to commodity operations research research on commodity trading operations workflows, 68% of traders at firms using fragmented data infrastructure report spending more than 90 minutes per day on data consolidation, normalization, or verification tasks. At a loaded cost of $150, $250 per hour for a senior front-office professional, that represents $225, $375 of overhead cost per trader per day, before a single risk position is analyzed.
Calculating the Daily Cost of Intelligence Gaps
The daily cost of operating without consolidated real-time metals intelligence, calculated across execution slippage, basis risk, missed arbitrage, and management overhead, typically ranges from $1,200 to $4,800 per trading day for a desk executing moderate cross-exchange volume. This figure is conservative: it excludes tail events in which incomplete data contributed to a materially incorrect pricing decision on a large notional position. The calculation represents a floor, not a ceiling.
The Four-Exchange Problem Most Platforms Never Solved
Most multi-commodity platforms were architected for breadth. The commercial rationale was straightforward: cover more markets, serve more buyers. The underlying assumption was that surface-level coverage across many commodities was an acceptable trade-off for analytical depth in any single one.
For base metals traders, that assumption produced precisely the fragmentation architecture described above, packaged in a single UI, but analytically incomplete in each market it claimed to cover.
According to a Chartis Research CTRM survey 2023 Chartis Research survey of commodity trading technology, 61% of metals trading professionals reported that their existing platform provided "adequate" but not "decision-grade" intelligence for cross-exchange metals analysis. "Adequate" is a specific descriptor in this context. It means the data is present. It does not mean the cross-exchange relationships, the inventory signal integrations, and the real-time spread calculations are operationally complete.
Evaluating Decision-Grade Data Infrastructure
Decision-grade metals infrastructure has four specific characteristics: sub-second data latency across all relevant exchanges, normalized cross-exchange pricing in a single reference currency without manual conversion, real-time inventory integration from LME, SHFE, and CME warehousing systems, and position tracking that reflects cross-exchange exposure simultaneously in a single view. Where any of these four characteristics require manual intervention to produce, the infrastructure is not decision-grade; it functions as an analytical bottleneck with a quantifiable daily cost.
Most desks running legacy or broad multi-commodity platforms are operating in the gap between "adequate" and "decision-grade." The cost-of-inaction calculation above applies specifically to that gap.
Consolidated Metals Market Intelligence: What the Calculation Changes
When the cost of inaction is calculated directly against actual execution patterns rather than estimated, the subscription decision changes in character entirely.
The decision shifts from comparing subscription fees against legacy systems to measuring platform costs against the daily expense of operating without one.
For a metals desk executing 5, 10 hedging transactions per week on a $50, 100M notional book, the four-component model yields a daily inaction cost between $1,200 and $4,800. A consolidated real-time metals market intelligence platform priced below that daily threshold represents an immediate operational saving.
According to commodity technology ROI research independent research on commodity trading technology ROI, firms that consolidate fragmented market data infrastructure into a single decision-grade platform report average reductions of 34% in execution slippage costs and 47% in time-to-decision latency within the first 90 days of deployment.
Depth-First Intelligence vs. Multi-Commodity Platforms
Depth-first commodity intelligence differs from multi-commodity platforms in one fundamental respect: it achieves decision-grade coverage on a specific market before expanding, rather than achieving surface-level coverage across many markets simultaneously. For base metals traders, this means LME, MCX, COMEX, and SHFE intelligence is built for operational completeness. In practice, this means cross-exchange relationships, inventory signal integrations, and real-time spread calculations are operational from deployment, not deferred to a future product iteration.
This distinction is precisely what the four-component cost model quantifies. "Adequate" coverage generates all four cost components. Decision-grade coverage addresses them directly.
Running the Calculation Against Your Desk Parameters
The cost-of-inaction methodology is not specific to any platform. Apply it to your own execution data before making any subscription decision.
Step 1: Execution slippage: Multiply your average weekly hedge count by your estimated cross-exchange synthesis delay in minutes by the average price movement per minute during your primary execution window. This is your weekly slippage exposure attributable to data fragmentation.
Step 2: Basis risk: Identify your average cross-exchange basis exposure as a percentage of notional. Apply the documented 1.8, 2.4% historical basis volatility range to your average position size. This is your monthly basis risk cost attributable to incomplete cross-exchange visibility.
Step 3: Opportunity cost: Estimate how many cross-exchange arbitrage windows your desk has missed or entered late in the past quarter due to fragmented data infrastructure. Multiply by a conservative $7,500 per window. This is your quarterly opportunity cost floor.
Step 4: Management overhead: Multiply your daily data synthesis time per trader by the number of traders on your desk by your loaded hourly cost. This is your daily overhead cost, recurring each trading session.
Sum the four components across a monthly trading period. Compare that figure against a Novaex Pulse monthly subscription. Novaex Pulse pricing
The model is designed purely for accuracy. If the cost-of-inaction does not exceed the subscription cost for your specific desk parameters, the subscription does not represent a sound financial decision for your operation. For desks executing cross-exchange hedging programs with meaningful notional exposure across LME, MCX, COMEX, and SHFE, the calculation does not require favorable assumptions to produce a clear answer.
Novaex Pulse deployment data shows users recover an average of 18 minutes per trader per day in manual synthesis time within the first two weeks. At a $200/hour loaded cost, that is $60 per trader per day recovered before any slippage reduction or arbitrage improvement is measured, a baseline return that begins accruing on day one of deployment.
The Decision the Calculation Produces
Budgetary hesitation on a subscription decision is a rational response to incomplete information. When the subscription cost is the only variable on the table, it registers as an expense line. When the daily cost of operating without consolidated metals market intelligence is quantified alongside it, the comparison is analytically complete.
The four-component model in this article is deliberately conservative. It excludes reputational cost from systematically uncompetitive pricing, counterparty relationship risk from repeated execution delays, and the compounding effect of operating at a structural information disadvantage across a full trading year. It also excludes the single tail-event scenario: one pricing decision made on incomplete cross-exchange data that produces a loss exceeding a full year of subscription costs.
What the model includes is sufficient to resolve the comparison for most desks with any meaningful cross-exchange exposure.
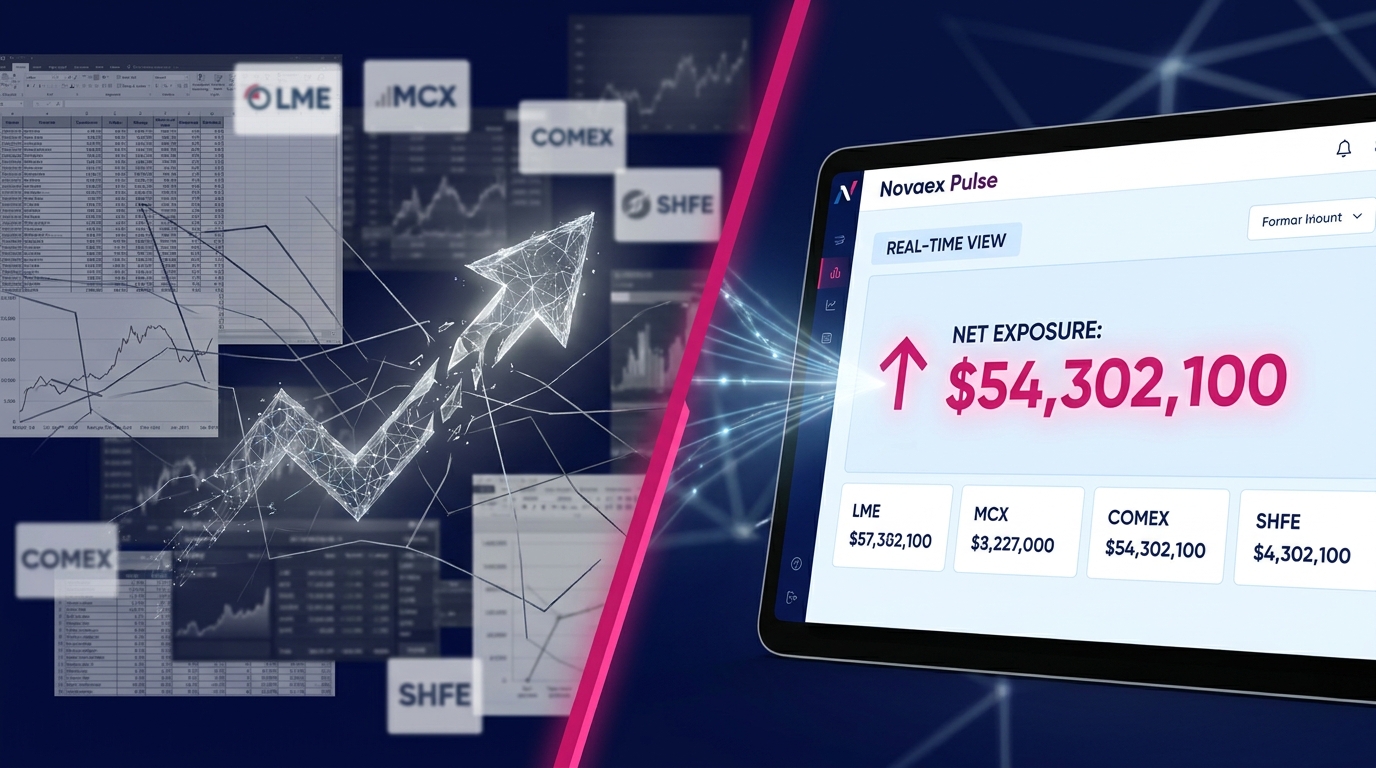
Evaluating a Novaex Pulse subscription against this framework is the logical next step. Each panel in the consolidated view corresponds directly to a component in the calculation, and its absence in your current infrastructure is the mechanism generating the cost.
Each additional trading day without consolidated LME, MCX, COMEX, and SHFE intelligence adds to a quantifiable and recurring cost. The calculation does not improve with time. It compounds.