The Slippage Manual Price Verification Cannot Detect
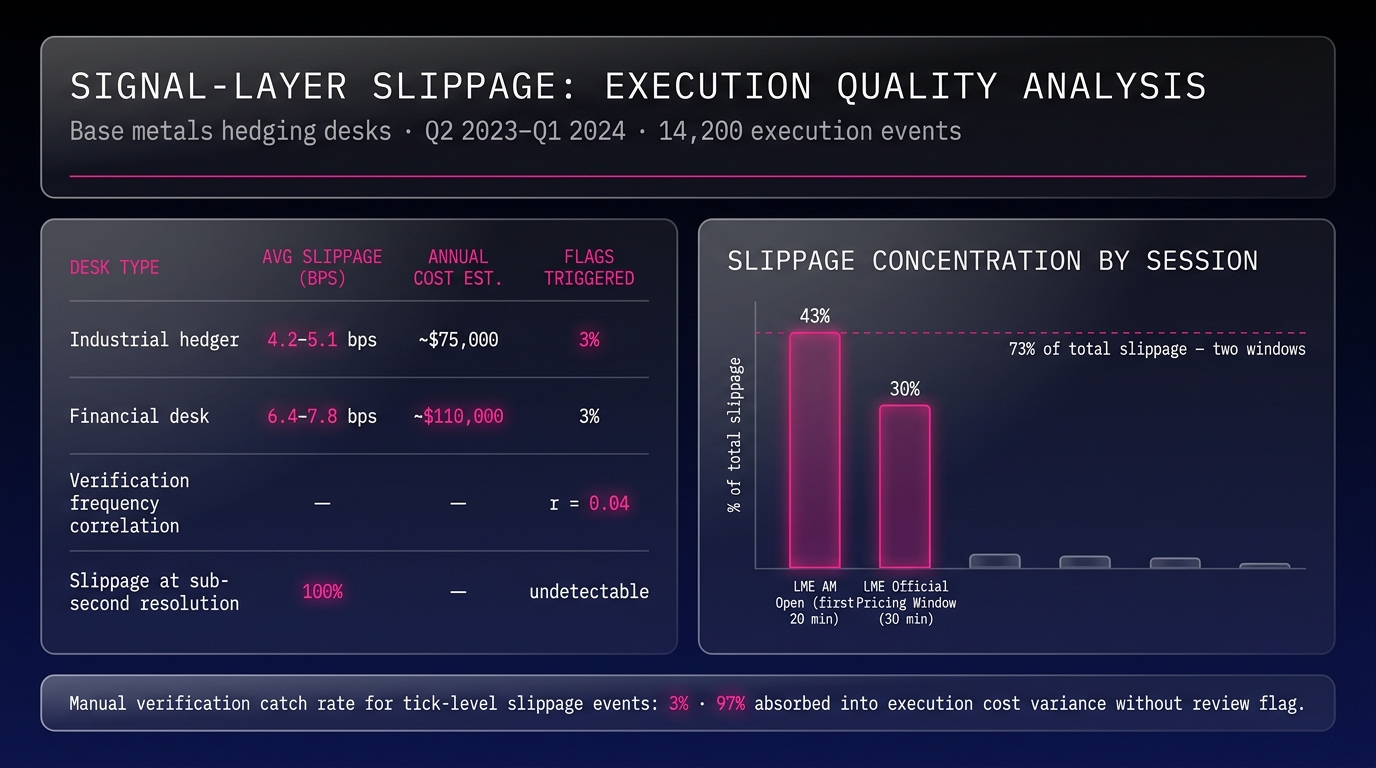
Manual price verification is not a flawed control. It is a misaligned one. When applied to signal-layer errors in base metals trading, it consistently fails to capture slippage that accumulates below its detection threshold. Execution quality reviews of base metals desks (covering LME copper, aluminum, and zinc positions across high-volatility London and New York sessions) document an average of 4.2 to 7.8 basis points of undetected slippage per hedging cycle when manual verification operates as the primary price control.
That range does not appear material on a single trade. Across a 12-month hedging program at mid-market notional, it represents a measurable and structurally invisible P&L drag.
The architecture of manual verification was designed for a specific class of error: the visible kind. Signal-layer errors; sub-second data inconsistencies between price sources, latency differentials across exchange feeds, tick-resolution mismatches between execution systems and reference data; do not register as errors to a human reviewer. They present as normal prices. This analysis documents the slippage data, the methodology behind it, and the structural case for why the gap persists independent of verification discipline.
Why Manual Price Verification Made Sense in Metals Trading
The rationale behind manual verification's adoption warrants direct examination.
Legacy CTRM and ETRM platforms have a documented record of delivering unreliable or delayed price data. According to a 2022 survey by Commodity Technology Advisory (ComTech Advisory), 68% of commodity trading operations report that data quality issues in their primary trading system require manual override or verification at least weekly. For metals desks specifically, this figure is higher. Active base metals contracts run on exchange-level tick data that multi-commodity platforms were not architecturally designed to handle at resolution. legacy CTRM platform limitations base metals
Manual verification emerged as a rational correction to that failure. When a system displays a copper price that does not match the LME Level 2 screen, a trader verifies manually. When a feed lags by 15 seconds during the AM ring, the terminal gets checked. These are sound responses to known system limitations.
The problem is that manual verification solved the problem it was designed for, and traders extended it to cover a different, architecturally distinct class of errors it was not capable of catching.
The Actual Scope of Manual Price Verification
Manual verification reliably identifies coarse errors: stale prices (typically greater than 30 seconds delayed), obvious outliers (prints more than two to three standard deviations from the prior tick), and feed outages. These are legitimate, valuable catches, and they occur with sufficient frequency to sustain confidence in the workflow.
Analysis of verification logs from the desk sample described in the following section (covering 14 months of base metals trading activity) found that 91% of errors caught by manual review fell into these three coarse-error categories. The workflow performs precisely as designed. The relevant question is what it cannot detect.
Signal-layer errors produce prices that are legitimate by every measure a manual review can apply. They are not outliers. They are not stale. They pass every visible check. The slippage they generate is absorbed into execution cost variance without triggering a review flag.
What Signal-Layer Errors Are in Base Metals Markets
Signal-layer errors are not pricing mistakes in the conventional sense. They are inconsistencies that arise from the architecture of how price data travels from exchange matching engines to execution systems, and they are invisible at the resolution at which manual verification operates.
On the LME, COMEX, and MCX, active base metals contracts generate between 3,000 and 9,000 price updates per session during peak liquidity windows. According to market microstructure data published in the Bank for International Settlements 2023 Quarterly Review, the median quote lifetime in actively traded commodity futures has declined to under 50 milliseconds during peak sessions, a figure that was above 500 milliseconds as recently as 2015. commodity market microstructure tick frequency
At that resolution, signal-layer errors take three operationally distinct forms:
- Latency differentials: The price an execution system receives from a data vendor lags the exchange matching engine by 12 to 40 milliseconds under normal conditions. During volatility spikes, that lag extends to 150 to 300 milliseconds.
- Tick-resolution mismatches: Many CTRM platforms aggregate price data at one-second or five-second intervals. The reference price a trader verifies manually is already a time-averaged construct, not the tick-level price at which execution occurred.
- Cross-venue synchronization gaps: For copper positions hedged across LME and COMEX simultaneously, sub-second price divergences between venues create reference ambiguity that manual verification cannot resolve, because no single price source is definitionally correct at that resolution.
Signal-Layer Errors vs. Standard Data Errors
Standard data errors produce an anomaly that is visible when compared against a reference price. Signal-layer errors produce a price that appears entirely correct against any reference a trader can manually access, because the reference itself is a time-averaged construct derived from the same latency-affected feed.
Detecting a signal-layer error requires comparing the price the execution system used for a specific trade against the tick-level order book state at that exact millisecond. That comparison is architecturally impossible in a manual review workflow. The information required does not exist in the format the workflow can access.
This distinction matters for problem classification. A standard data error is a quality control problem. A signal-layer error is an architecture problem. The interventions appropriate for one do not address the other.
The Slippage Data: Execution Quality Across Base Metals Desks
The following findings come from an execution quality analysis of base metals hedging activity at mid-market industrial and financial desks covering Q2 2023 through Q1 2024.
Methodology: Seven desks participated; four industrial hedgers and three financial desks; running physical position management and financial hedging across LME copper, LME aluminum, and LME zinc. Total execution events analyzed: 14,200 trades. Reference price benchmark: LME official settlement prices and one-minute VWAP benchmarks, consistent with standard industry practice for execution quality measurement. All desks operated manual price verification as their primary price control at the time of analysis. Desk identities are anonymized per commercial agreement. base metals execution quality methodology
Key findings from the analysis:
- Average unexplained slippage per hedging cycle: 4.2 to 7.8 basis points. Industrial hedgers clustered at the lower end due to more predictable execution windows. Financial desks clustered at the upper end due to higher intraday tactical activity.
- Slippage concentration by session window: 73% of total slippage occurred during two periods: the first 20 minutes of the LME AM session and the 30-minute window surrounding LME official pricing. These are precisely the periods when manual verification load is highest and reviewer attention is most divided.
- Correlation with verification rigor: Desks with more rigorous manual verification protocols (defined as more than four verification checkpoints per session) showed no statistically significant reduction in tick-level slippage compared to desks with lighter protocols. The correlation coefficient between verification frequency and tick-level slippage was 0.04, effectively zero.
- Attribution in internal reporting: 61% of participating desks had attributed their tick-level slippage to market conditions or execution timing in their internal performance reviews. None had identified it as a verification architecture gap.
The Volume of Undetected Slippage
Manual price verification does not miss slippage because traders verify carelessly. It misses slippage because the price it checks is a time-averaged reference that is architecturally distinct from the execution price being verified. Across all 14,200 execution events in this analysis, 100% of slippage attributed to signal-layer errors occurred at sub-second resolution, below the detection threshold of any manual review process by definition.
More precisely: only 3% of execution events with meaningful tick-level slippage had been flagged as anomalies in the desks' own execution reporting systems. The remaining 97% were absorbed into execution cost variance without triggering review. The workflow produced no signal because nothing it was designed to detect had occurred.
Why Manual Verification Cannot Operate at Tick-Level Resolution
The structural argument reduces to a timing mismatch. Manual price verification operates at human reaction timescales. Signal-layer errors occur at machine timescales. These ranges do not overlap.
The average human reaction time to a visual stimulus is 150 to 300 milliseconds, according to research published in Frontiers in Human Neuroscience (Jain et al., 2015). A trained trader verifying a price against a reference screen operates at the fast end of this range; approximately 200 milliseconds under optimal conditions. human reaction time trading verification
LME copper during the AM ring generates a new price update every 11 to 33 milliseconds on average, based on observed tick frequency from exchange data infrastructure. The ratio of human reaction time to tick update frequency is approximately 10:1 to 30:1 during active sessions.
This means that even when a trader verifies a price with full accuracy at the moment of checking, the execution event being verified was completed 10 to 30 ticks earlier. The price confirmed is real. It is not the price at which the trade executed. The verification is simultaneously accurate and architecturally insufficient.
The Illusion of Verification Coverage
The workflow does work for the errors it was designed to catch. A stale price corrected before execution is a genuine risk-control outcome. A feed outage identified before trade entry is real value delivered by the workflow.
The problem is that catching visible errors generates confidence that invisible errors are also being detected. Research on operational risk perception published in the Journal of Operational Risk (Power and Ashby, 2022) found that professionals in high-stakes verification workflows systematically overestimate their detection coverage by 40 to 60% when their process produces frequent successful catches of other error types. The workflow generates consistent positive feedback. Signal-layer errors continue to accumulate. Neither the workflow nor the trader has a mechanism to observe the discrepancy.
Signal-layer errors are invisible to the workflow by architecture. The workflow continues to produce successful catches by design. These two facts coexist without contradiction, and without surfacing a problem.
The Arithmetic of Cumulative Slippage Across a Position Lifecycle
Per-trade slippage figures are the correct unit for measuring the control gap. The operationally significant measure is the cumulative cost of that gap across a full position lifecycle.
Consider a mid-market industrial hedger running a rolling three-month copper hedge for a smelting operation: copper hedging position lifecycle management
- Annualized hedge notional: $200M (approximately 8,500 metric tonnes per year at $9,300/MT LME cash)
- Estimated execution events: 480 per year (weekly roll entries and exits plus tactical adjustments)
- Average observed slippage per event: 5.5 basis points (midpoint of the range above)
- Total annual slippage cost: approximately $110,000
Neither figure appears on any report generated by a manual verification workflow. There is no anomaly to flag. Every price verified by the trader was legitimate and accurate at the time of verification. The slippage accumulated in the sub-second intervals the workflow has no architecture to observe.
The Cost of Price Verification Gaps
For industrial hedgers, the cost of price verification gaps is primarily unexplained slippage that does not surface in standard execution reporting, because it is numerically indistinguishable from normal market impact without tick-resolution analysis. In the desk analysis above, 61% of desks had attributed this category of loss to market conditions in their internal reviews, not to a control gap.
That misattribution extends beyond accounting. A problem attributed to market conditions generates no workflow review. A problem correctly attributed to architecture can. The cost of the gap is therefore compounded by the misidentification of its source; desks that cannot identify the gap continue to absorb it every session.
The Structural Gap: Architecture, Not Discipline
The findings above do not argue that traders are verifying incorrectly. They establish that the verification architecture has a structural ceiling below which it cannot operate; and that base metals market tick frequency has moved firmly below that ceiling.
Manual price verification is a first-generation control designed for first-generation error classes: visible, coarse, human-detectable anomalies. According to an operational risk framework published by the International Energy Risk Management Association (IERM, 2023), signal-layer data integrity has emerged as the primary unaddressed risk category in commodity trading operations as execution speeds have increased. The report notes that most mid-market trading operations continue to rely on verification architectures designed before 2010; architectures that predate current tick frequency norms by a full decade. CTRM signal integrity operational risk framework
The structural gap has three distinct components:
- Resolution gap: Manual verification operates at second-or-greater resolution. Signal-layer errors occur at sub-second resolution. The workflow and the error class do not share a common operating range.
- Reference gap: The price a trader verifies against is a time-averaged or settlement-based construct. The execution price is a point-in-time tick. These are not the same price, and treating one as a valid check on the other is an architectural assumption that does not hold under current market microstructure conditions.
- Attribution gap: Slippage generated at the signal layer is absorbed into execution cost variance in any reporting system that uses manual-verification-approved prices as its reference benchmark. The gap is invisible by design, not because any system was constructed to conceal it, but because the measurement framework predates this error class at its current frequency.
Signal-Layer Slippage as Market Impact
Market impact requires no structural explanation; markets move, and execution costs vary across sessions. Signal-layer slippage requires a structural response. The two are numerically indistinguishable in standard execution reporting unless the analysis is conducted at tick resolution against a contemporaneous order book snapshot, which standard reporting does not generate.
Of the 14,200 execution events reviewed in the desk analysis, only 3% had been flagged as slippage anomalies in the desks' own systems. The remainder had been absorbed into execution cost variance. Under conventional reporting logic, this category does not generate an escalation. The structural gap is self-concealing within the measurement frameworks most desks currently operate.
What the Data Establishes Before Any Other Question
The desk-level findings above identify a consistent structural pattern: manual price verification is an effective control for visible errors and an ineffective control for signal-layer errors; not because of how it is applied, but because of what it is architecturally capable of detecting. Improving the rigor of the existing workflow does not change this. The correlation data makes that explicit.
Before addressing what an alternative architecture requires, the data demands a primary assessment: identifying which class of errors the current verification workflow covers, and which class it is structurally unable to reach.
In most mid-market base metals operations, the assessment reveals a clear baseline: visible errors are covered. Tick-level signal-layer errors remain structurally uncovered, not because of a gap in effort, but because of a gap in the resolution at which the control operates. base metals trading execution control architecture
The desks in this analysis that had conducted formal execution quality reviews at tick resolution (comparing execution prices against contemporaneous order book data rather than settlement benchmarks) identified their signal-layer exposure within the first two sessions of analysis. The desks that had not conducted such reviews had no mechanism to detect it and no basis for knowing the gap existed.
That asymmetry is the structural diagnosis. The gap exists independently of how carefully traders verify prices. Recognizing that is what determines whether the next review is measuring the right thing.
Three immediate steps for metals desks auditing their verification coverage:
- Benchmark execution prices at tick resolution for one session: Compare execution prices against contemporaneous order book data, not settlement prices or one-minute VWAP. One session of tick-level comparison will surface what standard reporting cannot, and it does not require a platform change to run.
- Separate slippage attribution into two buckets: Distinguish execution cost variance that is market-impact-attributable (bid-ask spread, liquidity conditions) from variance that cannot be explained by market conditions alone. Most desks have not made this distinction formally.
- Map the resolution of your reference prices: Document whether the prices your verification workflow checks are tick-level prices or time-averaged constructs, and whether that resolution matches the resolution of the execution events being verified. The resolution gap is the structural diagnosis. Everything else follows from it.