The Total Cost of Spreadsheet Hedging Workflows
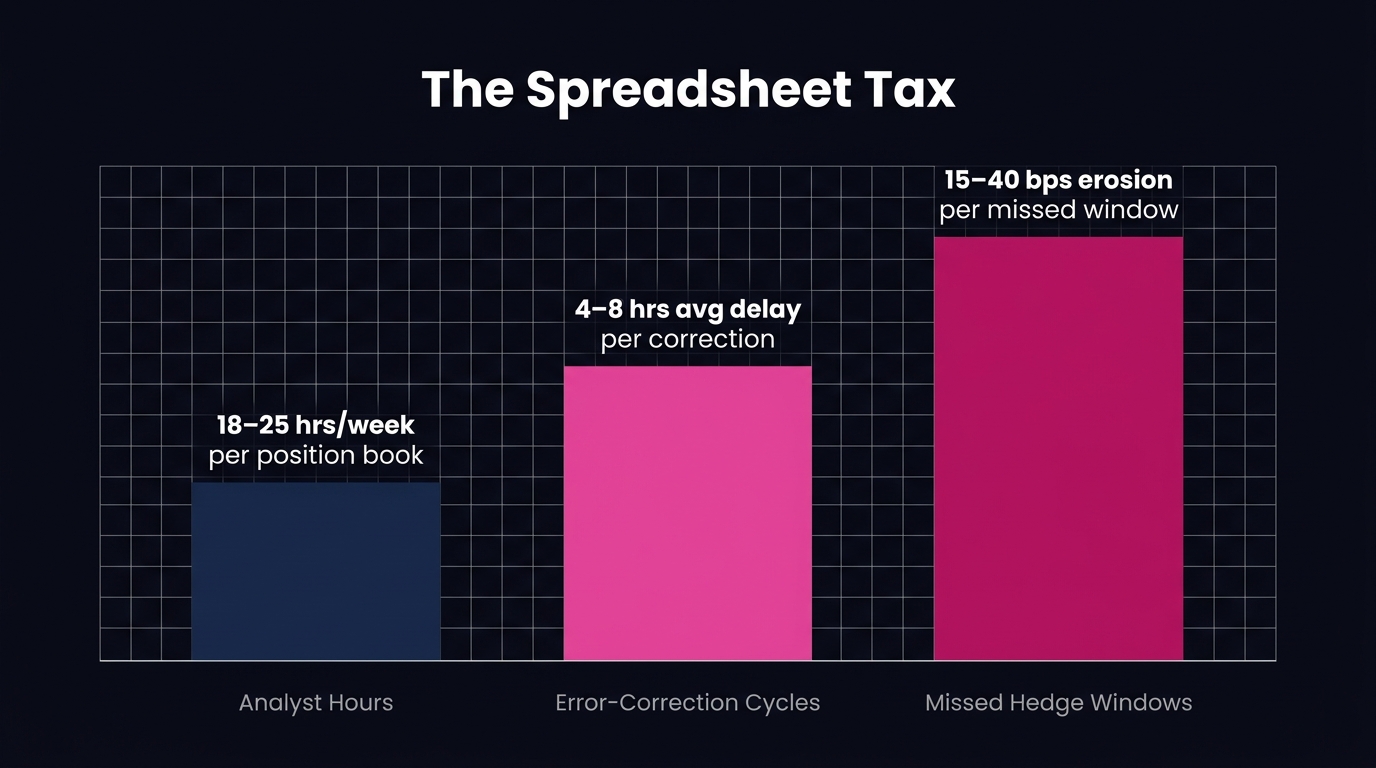
Spreadsheet-based hedging workflows carry three distinct cost layers, not one. The full total cost of ownership includes analyst labor hours consumed by manual data management, rework cycles generated by formula errors and version conflicts, and quantifiable opportunity cost from missed hedge windows. For a mid-market metals trading operation, these three layers combined can exceed $250,000 annually. The third layer (missed hedge windows) is both the largest and the least visible.
Most treasury and risk teams calculate their hedging workflow cost by looking at software licensing and a rough estimate of analyst time. That calculation captures perhaps 30, 40% of the true total.
The remaining cost is structural and largely invisible. It does not appear on a timesheet. It does not generate a purchase order. But it is recoverable. Quantifying it precisely is a prerequisite for any rational infrastructure decision.
This analysis builds a complete three-part TCO model for spreadsheet-based hedging workflows, with each layer grounded in observable operational benchmarks.
Why Standard Cost Analysis Misses Most of the Total
Measuring workflow cost by direct labor hours is a natural starting point. Hours are visible, billable, and easy to aggregate. They produce a number that can be placed on a slide and defended in a budget review.
But spreadsheet-based hedging workflows generate costs through three distinct mechanisms, and only the first is captured by standard labor accounting. The second operates as a cost multiplier. The third operates as an opportunity destroyer.
The Difficulty of Costing Spreadsheet Workflows
The difficulty lies in how costs are distributed across time and responsibility. Analyst hours appear on a timesheet. Error-correction cycles are absorbed into broader reconciliation line items with no separate coding. Missed hedge windows never appear anywhere. They are counterfactual costs, visible only by measuring the gap between when a hedge was placed and when it should have been placed.
A rigorous TCO model requires treating each layer independently and then combining them. The structure below does exactly that.
The three-layer framework is analytically necessary because each cost responds to distinct operational interventions. Reducing analyst hours requires automation. Reducing error-correction cycles requires structural data integrity. Reducing missed hedge windows requires real-time position visibility at the moment of execution. Spreadsheets cannot provide this capability regardless of how well-maintained they are.
Spreadsheet Hedging Cost Layer 1: Analyst Hours
The first cost layer is the most quantifiable: direct analyst time consumed by workflow mechanics rather than decision-making.
In a manual spreadsheet environment, this time subdivides into three operational buckets:
- Data collection and import: Pulling LME, COMEX, or SHFE settlement prices, populating position registers, and reconciling broker confirms against internal records
- Model maintenance: Updating formulas, refreshing linked tabs, resolving broken references, and managing version control across shared files
- Reporting preparation: Building exposure summaries, delta calculations, and mark-to-market reports for daily risk review
Analyst Hours Dedicated to Workflow Management
In commodity trading operations relying on spreadsheet-based workflows, front-office and middle-office personnel typically spend between 35, 50% of their working day on data preparation and reconciliation rather than analysis or execution. For a dedicated hedging analyst carrying a fully-loaded annual cost of $85,000, $120,000, that allocation translates to $29,750, $60,000 per year in labor directed at workflow mechanics rather than active trading.
McKinsey Global Institute research establishes that knowledge workers across industries spend approximately 19% of their time searching for and gathering information, and that figure rises substantially in environments without integrated data systems McKinsey Global Institute knowledge worker productivity research. For metals trading operations, where live data is fragmented across exchange feeds, broker confirmation platforms, and internal ERP systems, the figure sits firmly at the high end of the operational range.
At two analysts (a minimum staffing level for any operation running live commodity hedges across multiple tenors) the annual direct labor cost of spreadsheet workflow mechanics falls between $59,500 and $120,000.
This is the number most teams actually calculate. It is also the smallest of the three cost layers.
Cost Layer 2: Error-Correction Cycles and Their Hidden Multiplier
The second cost layer is generated by the structural error rate inherent to complex, multi-tab spreadsheet models operated under time pressure and across multiple users.
Spreadsheet errors in hedging workflows are not randomly distributed. They cluster in three specific operational moments: position roll dates (when expiring contracts are replaced and formula references must be updated), month-end reconciliations (when multiple tabs are consolidated and linked-cell chains are stressed by new data), and any transition point where a new analyst inherits a file built by someone else.
Common Structural Errors in Spreadsheet Hedging
The most consequential errors in spreadsheet-based hedging are reference errors in exposure calculations, sign convention failures (long/short misrepresentation), and date logic errors in roll and settlement schedules. These represent structural failures in model logic rather than typographical errors, producing materially incorrect hedge ratios or P&L misstatements before any review process identifies them.
Research by Raymond Panko of the University of Hawaii established that 88% of spreadsheets in operational use contain errors. This finding is corroborated by the European Spreadsheet Risks Interest Group (EuSpRIG) across multiple longitudinal studies spanning more than two decades EuSpRIG spreadsheet error research. In financial modeling contexts, KPMG has documented that undetected spreadsheet errors have contributed to material misstatements in operational risk calculations at major institutions.
The Diagnostic Burden of Spreadsheet Errors
Locating an error in a complex, interconnected hedging spreadsheet is structurally harder than introducing one. A formula error introduced in thirty seconds can require three to six hours to locate and verify when it is embedded in a 40-tab workbook with circular references and externally linked price feeds. The diagnostic process involves tracing precedents and dependents across files that were not designed with auditability as a requirement.
The operational benchmark for error-correction cycles in spreadsheet-based hedging workflows is 4, 8 hours of analyst time per incident, with incidents occurring at a frequency of 2, 4 times per month in active operations. At the midpoint of both ranges of 6 hours per incident and 3 incidents per month, the annual error-correction burden is 216 analyst hours.
At a fully-loaded hourly cost of $55, $70 for a mid-level analyst, this layer adds $11,880, $15,120 annually in direct rework cost.
The more significant cost, however, is not the rework hours themselves. It is the decision latency created when an error is suspected but unconfirmed. During the period between error discovery and verified resolution, positions cannot be confidently managed. Hedges may not be extended. Exposures may sit uncovered. That latency connects directly to the third and most consequential cost layer.
Cost Layer 3: Missed Hedge Windows in Spreadsheet-Based Workflows
Missed hedge windows are the most consequential component of the spreadsheet-based hedging TCO and the least likely to appear in any standard workflow cost analysis.
A missed hedge window functions as an opportunity cost: the quantifiable difference between the hedge execution price available at the optimal decision moment and the price obtained when the workflow was finally ready to execute. In metals markets that move 1, 3% on active trading days, this gap is not theoretical.
The Quantifiable Cost of Missed Windows
The cost of a missed hedge window depends on three variables: position size, the price movement during the execution delay, and the frequency of delay events across a trading year. For a mid-market copper trader managing a 500-tonne monthly hedge program, the arithmetic is direct.
LME copper has historically traded with daily price ranges of $80, $200 per tonne during periods of elevated volatility LME copper historical price data. On a 500-tonne position, a $100/tonne adverse move during a two-hour workflow delay translates to $50,000 in opportunity cost on a single transaction. That cost does not appear in any error log. It is embedded in execution quality, recorded as a completed hedge at the price obtained, with no reference to the price that was available.
Not every delay produces an adverse outcome. Markets move in both directions, and a delay occurring during a favorable move improves execution quality. The relevant metric is the expected cost of execution delay, which accounts for the asymmetry between delay risk and delay benefit. In trending markets or around scheduled data releases (LME inventory reports, SHFE warrant announcements, Federal Reserve decisions, or major macroeconomic prints) the probability of adverse movement during a workflow delay is meaningfully higher than 50%.
The Invisibility of Counterfactual Costs
Missed hedge windows are invisible because they are counterfactual. No standard report shows what price was available at 9:47 AM when the position report was still being manually reconciled and the trader could not confidently confirm their exposure. The hedge that executed at 10:23 AM at a $45/tonne worse level is recorded as a completed transaction with a specific price. The $22,500 in opportunity cost on that 500-tonne execution is recorded as market outcome rather than workflow outcome.
Operational surveys of commodity trading desks establish that workflow-driven execution delays of 45 minutes to 3 hours are common in spreadsheet-dependent environments during high-activity periods, precisely the windows when price movement risk is highest commodity trading workflow efficiency benchmarks. The delay and the market volatility are positively correlated, which means the expected cost of missed windows is higher than a simple average would suggest.
For a trading operation running 24 hedge transactions per year (two per month), with an assumed adverse delay frequency of 30% (a conservative estimate for operations that include scheduled event windows) and a midpoint opportunity cost of $25,000 per affected transaction, the annualized missed hedge window cost is:
24 transactions × 30% frequency × $25,000 midpoint = $180,000
This figure is illustrative and position-size dependent. Operations with larger position sizes, higher trade frequency, or greater exposure to volatile base metals such as zinc or nickel will see this number move substantially higher. Operations with small, infrequent hedge programs and disciplined manual processes will sit near the lower bound. The magnitude of Layer 3 relative to the other two layers is the operative finding, rather than any single point estimate.
The Full Spreadsheet Hedging TCO: All Three Layers Combined
With all three layers quantified, the complete TCO for a mid-market metals hedging operation using spreadsheet-based workflows assembles as follows:
| Cost Layer | Annual Range | Basis |
|---|---|---|
| Analyst labor (workflow mechanics) | $59,500, $120,000 | 35, 50% of 2-analyst team, fully loaded |
| Error-correction cycles | $11,880, $15,120 | 216 hrs/year at $55, $70/hr |
| Missed hedge windows | $60,000, $360,000+ | Illustrative; position-size and frequency dependent |
| Total TCO | $131,380, $495,120+ | |
The range is wide because the missed hedge window cost is sensitive to position size, trade frequency, and the volatility profile of the specific metals being hedged. The lower bound applies to small, infrequent hedge programs with disciplined manual processes and limited exposure to high-volatility metals. The upper bound reflects active programs in copper, zinc, or aluminum with multiple monthly hedge transactions.
The table establishes the relative weight of each layer. The first two layers, the only ones typically included in workflow cost analysis, represent at most 27% of the total at the midpoint of the range. The third layer, which rarely appears in any standard cost model, represents the majority.
Deloitte analysis of manual process costs in financial operations found that organizations failing to account for opportunity cost in workflow TCO calculations systematically underestimate infrastructure investment cases by 60, 70% Deloitte financial operations process cost research. The spreadsheet hedging TCO follows exactly that pattern: standard analysis captures the smallest cost layer and ignores the largest.
What a Purpose-Built Platform Changes in This Calculation
The three-layer TCO structure above is not an argument against spreadsheets as a category. It is a cost model for a specific use case: real-time commodity hedging workflows where execution timing, position accuracy, and data integrity are directly and measurably connected to financial outcomes.
A purpose-built hedging platform addresses each cost layer through a distinct structural mechanism:
Layer 1 (Analyst Hours): Automated price feed integration, live position registers, and pre-built exposure reporting eliminate the data collection and model maintenance workload. Operational benchmarks for automation adoption in commodity trading environments indicate a 60, 80% reduction in workflow mechanics time is achievable within the first year of deployment CTRM platform automation benchmarks. The analyst hours recovered are redirected to decision-making rather than data preparation.
Layer 2 (Error-Correction Cycles): System-enforced data integrity, immutable audit trails, and single-source-of-truth position management eliminate the class of errors that spreadsheets are structurally prone to generating. The error-correction cycle cost moves toward zero, not because analysts become more careful, but because the architecture removes the conditions under which these errors originate.
Layer 3 (Missed Hedge Windows): This is where the infrastructure investment case is most compelling. A platform delivering real-time position visibility means hedge windows are not missed because a position report is still being manually reconciled. The execution delay that generates opportunity cost is eliminated at its source: the trader has confirmed exposure data at the moment of decision, not forty minutes after it.
This is the operational standard that defines the Novaex approach to base metals. Rather than building surface-level coverage across a broad commodity universe, Novaex establishes complete position management and pricing intelligence infrastructure for each metal (LME, COMEX, SHFE, and MCX data integrated, not aggregated) before expanding coverage [LINK: Novaex base metals platform]. The result is that a copper trader has verified position visibility at 9:47 AM rather than 10:23 AM after a manual reconciliation cycle completes. This architecture directly supports workflows where execution timing determines financial outcomes.
For operations where the TCO calculation above produces numbers in the $200,000, $400,000 range, the infrastructure investment case is straightforward arithmetic. The cost of the current workflow is the correct benchmark against which any platform cost must be measured, not the licensing fee in isolation.
Conclusion
The true total cost of spreadsheet-based hedging workflows requires a broader perspective. It involves a three-layer cost structure where the most visible layer is the smallest, and the most consequential layer never appears on any standard report.
Error-correction cycles roughly double the visible labor cost before the missed hedge window analysis begins. Missed hedge windows then represent the majority of the total for any active commodity hedging program, and that cost scales directly with position size, trade frequency, and market volatility.
Three immediate steps to run this calculation against your own operation:
- Audit analyst time allocation for 30 days, separating workflow mechanics (data entry, reconciliation, model maintenance, report building) from actual analysis and execution activity. The ratio between those two categories is typically the first number that changes a budget conversation.
- Log error-correction incidents over 90 days. Include any event where a position number was questioned, a formula was verified, a report was rebuilt, or a reconciliation was rerun. Assign hours to each. Multiply by your fully-loaded hourly cost.
- Review execution timestamps on your last 12, 24 hedge transactions against the price available at the moment the hedge decision was made. The gap between decision-point price and execution price, adjusted for market movement during the delay, is the closest operational approximation of your missed hedge window cost.