What Spreadsheet Commodity Trading Really Costs
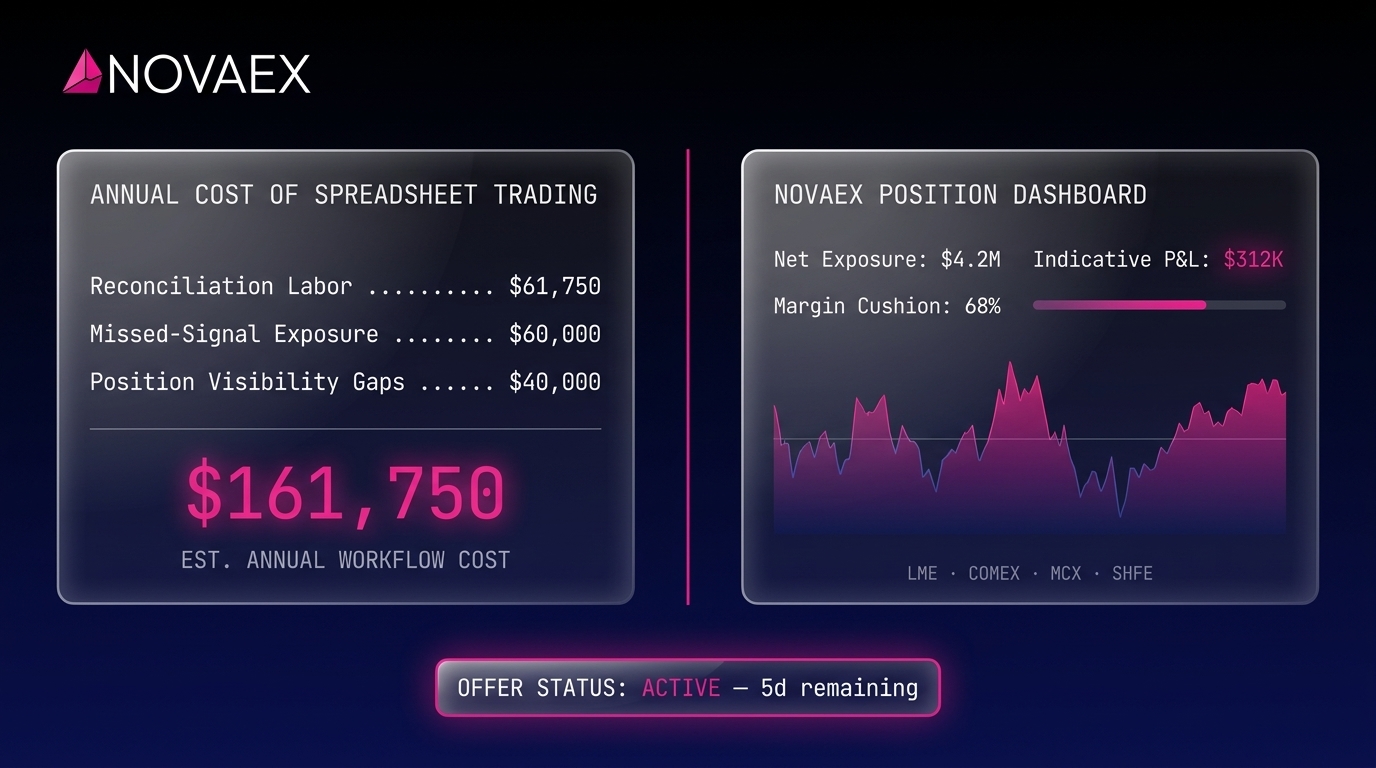
Summary: The cost of spreadsheet-based commodity trading breaks down into three measurable categories: reconciliation labor, missed-signal exposure, and position visibility gaps. When you compare these annual costs to a dedicated platform subscription, the spreadsheet workflow is consistently more expensive. This post walks through that comparison using a straightforward, three-column methodology you can apply to any mid-market metals trading desk.
Most commodity trading desks know spreadsheets have limits. Far fewer have actually calculated what those limits cost.
The problem with these costs is that they don't show up on a formal balance sheet. Reconciliation hours are buried in payroll. Missed signals hide as unexplained P&L variance. Position visibility gaps show up as delayed decisions right when execution timing matters most.
Let's build the ledger where these costs actually belong.
Building the Cost Ledger Your Spreadsheet Never Shows
Every accurate cost comparison needs a common unit of measurement. Here, we're using annualized desk cost: the total yearly recurring cost tied to your workflow choices, per desk.
Three columns make up this ledger:
- Reconciliation labor cost: The time spent maintaining, checking, and correcting spreadsheet positions, multiplied by the desk's hourly rate.
- Missed-signal cost: The estimated financial exposure from delayed or missed risk signals.
- Position visibility gap cost: The economic penalty of trading with incomplete or stale data during active market windows.
A McKinsey & Company analysis found that skilled workers in data-heavy roles spend an average of 1.8 hours a day searching for or reconciling information—about 23% of their workday McKinsey productivity in financial services. For many front-office trading desks, that's a starting point, not a ceiling.
The goal here is simple: Make the cost of spreadsheet workflows visible and measurable. If you can't measure a cost, you can't compare it. And if you can't compare it, you can't make an informed decision.
How do you calculate the cost of manual trade reconciliation?
Manual trade reconciliation cost equals the total annual hours spent reconciling multiplied by the fully loaded hourly rate of the people doing the work. Both variables are usually undercounted. Hours need to include upstream data entry, error-checking, fixing discrepancies, and supervisory review—not just the reconciliation itself. The rate must reflect total employment costs (benefits and overhead), not just base salary.
The Reconciliation Labor Cost: An Example Calculation
Let's use a mid-market metals trading desk as our baseline. Substitute your own figures to see how your desk stacks up.
Assumptions:
- Desk size: 3 traders with active LME or COMEX positions
- Daily reconciliation time per trader: 45 minutes (position reconciliation, mark-to-market checks, exposure summary updates)
- Supervisory review time: 20 minutes per day (risk manager or head trader)
- Fully loaded hourly desk rate: $95/hour (reflects mid-market front-office compensation, including benefits and overhead, at roughly $190,000 to $220,000 total annual cost per seat)
- Working days per year: 252
| Input | Value |
|---|---|
| Trader reconciliation (45 min × 3 traders) | 135 min/day |
| Supervisory review | 20 min/day |
| Total daily reconciliation time | 155 min (2.58 hours) |
| Annual hours (2.58 × 252) | 650 hours |
| Fully loaded hourly rate | $95/hour |
| Annual reconciliation labor cost | $61,750 |
A desk with two traders making $120/hour, each spending 30 minutes a day on spreadsheets, will look different. But the formula works for any setup.
How much time do commodity traders spend reconciling spreadsheet positions?
Industry surveys consistently show spreadsheet-dependent commodity traders spending 30 to 90 minutes a day on position maintenance. For desks managing multiple exchange legs across LME, COMEX, and MCX, you're usually looking at the higher end of that range.
What this labor cost doesn't capture is opportunity cost. A front-office trader spending 45 minutes fixing a spreadsheet isn't monitoring live LME curves, reviewing warrant data, or analyzing spread relationships. We left that foregone market attention out of the math to keep our estimate conservative.
The International Swaps and Derivatives Association (ISDA) flags manual processes as a major control weakness in commodity trading, with operational risk—including reconciliation failures—acting as a massive industry-wide cost ISDA operational risk framework for commodity firms.
The Cost of Missed Signals
This is the most critical cost to measure, yet the most commonly ignored. Because missed-signal costs only show up in hindsight—and are rarely traced back to their actual cause—they fly under the radar year after year.
A missed signal is any of the following:
- A position breach you didn't catch until after the market closed
- A rolling decision made on stale data that led to a bad spread outcome
- A late warrant or physical delivery signal that forced a reactive scramble
- A margin call that caught you off guard
How to estimate this cost:
Let's look at frequency multiplied by magnitude:
- Estimated missed-signal events per year: 4 (just one notable missed signal per quarter)
- Estimated average cost per event: $15,000 (e.g., a suboptimal rolling decision on a 50-lot LME copper position where the 3-month spread moved 10 points against a late execution at $25/lot per carry point)
- Annual missed-signal cost: $60,000
This is a conservative guess. A single missed margin call on a large copper or aluminum book can easily blow past this number. Use your own position sizes and historical P&L variances to find your true number.
What is the true cost of a missed hedging signal?
It comes down to position size, market speed, and how long the signal goes unnoticed. For a 100-lot LME copper position, a one-day delay in spotting a bad roll position can cost $1,000 to $3,000 at typical carry spreads. If that gap goes unnoticed for a few days, the losses compound.
Accenture research shows that commodity trading firms using manual risk systems have 15% to 20% higher operational loss rates than firms using integrated platforms Accenture commodity trading operations study. The reason is exactly what we're modeling here: late signals lead to decisions based on bad information.
Position Visibility Gaps: Pricing the Invisible Risk
Position visibility gaps are fundamentally different from missed signals. A missed signal is a specific event with a clear outcome. A visibility gap is the ongoing reality of not knowing your exact net position at any given moment—and not realizing you're in the dark.
For a metals trader managing LME prompt date exposure alongside physical delivery commitments across multiple counterparties, the difference between the spreadsheet and reality can mean material unhedged risk during the trading session.
What does a position visibility gap cost a metals trading desk?
You calculate this by multiplying your estimated unhedged position by market volatility and gap duration, then summing it up across sessions where the gap matters. Risk managers already do this after the fact when investigating unexplained P&L numbers. Doing it proactively turns an audit into actual risk management.
Example inputs:
- Estimated average untracked or stale position delta: 10 lots (copper equivalent)
- Average daily LME copper price movement: 0.8% (trailing 12-month average)
- Contract value basis: $25,000 per lot (assuming ~$9,000/tonne copper, 25-tonne lot)
- Sessions with material visibility gaps: 20 per year
| Input | Value |
|---|---|
| Untracked position delta | 10 lots |
| Daily move applied (0.8% × $25,000) | $200/lot/day |
| Annual gap exposure (20 sessions × 10 lots × $200) | $40,000 |
Again, this is conservative. Desks with larger books, more exchange legs, or higher volatility will see much bigger numbers.
Based on LME market data, LME copper 3-month prices showed annualized volatility of 18% to 22% between 2022 and 2023. Daily moves averaged 1.0% to 1.2% during volatile periods LME market statistics and volatility data. At those rates, the gap cost jumps to $50,000 or $60,000.
Spreadsheets vs. Structured Platforms: The Final Tally
Now we have our complete ledger.
Annual cost of spreadsheet-based commodity trading:
| Cost Category | Annual Figure |
|---|---|
| Reconciliation labor | $61,750 |
| Missed-signal exposure | $60,000 |
| Position visibility gap risk | $40,000 |
| Total annual cost | $161,750 |
This is a baseline using mid-range inputs. Desks with higher pay structures, larger books, or more complexity will see much higher totals.
A Novaex subscription is the fixed annual cost on the other side of this ledger. When you compare a fixed subscription to these massive workflow costs, the math makes the decision for you.
Gartner found that financial firms replacing manual data workflows with dedicated platforms see a median payback period of 9 to 14 months, cutting operational costs by 20% to 35% Gartner financial software ROI benchmarks. When you amortize a platform subscription against a $161,750 annual drain, you don't need wild ROI projections to justify the switch.
When does switching from spreadsheets to CTRM software make financial sense?
The switch makes sense the moment the cost of your manual workflow—labor, missed signals, and risk combined—exceeds the cost of the platform and its implementation. For most mid-market metals desks running the numbers above, that happens well before the end of year one. The real question is whether you've actually run the numbers.
Why You Can't Afford to Wait
Waiting has a price tag. At $161,750 annually, every quarter you stick with spreadsheets costs you roughly $40,000 in operational waste that a platform would eliminate. Every quarter you wait is a decision to absorb that loss.
Current metals market conditions make this even more urgent. LME copper, aluminum, and zinc markets have seen higher volatility since 2021 due to supply chain shifts and energy costs. The World Bank reports that base metals price volatility jumped 35% between 2020 and 2023 World Bank Commodity Markets Outlook base metals. High volatility crushes the margin for error on a trading desk. A visibility gap that costs $40,000 in a calm market costs significantly more when daily swings increase.
Spreadsheets made sense when markets moved slower and trading was simpler. Today, they are a financial liability. For most mid-market metals desks, the cost of keeping spreadsheets has already surpassed the cost of replacing them.
PwC's 2023 Commodity Trading Survey found that 67% of trading firms view manual data processes as their top operational risk, yet less than 30% actually know how to quantify that cost PwC Commodity Trading Survey 2023. This post gives you the framework to close that gap.
Novaex was built specifically for this transition. It gives you real-time position visibility, integrated pricing across LME, MCX, COMEX, and SHFE, and risk analytics that don't require 45 minutes of manual updates every morning. Our system is built around how base metals actually trade, not adapted from a generic multi-commodity tool.
Building Your Own Three-Column Ledger
You can replicate this exact analysis for your own desk in three steps:
Step 1: Measure reconciliation hours
Log one full trading week in detail. Don't guess—record it. Include all position maintenance, error correction, and review time. Multiply the weekly hours by 52. Multiply that by your fully loaded hourly rate. That's your reconciliation labor cost.
Step 2: Quantify missed signals
Look at your last 12 months of P&L variance. Find the events where delayed info, stale positions, or missed alerts led to bad execution or unplanned exposure. Estimate the cost of each event and add them up.
Step 3: Calculate visibility gap exposure
Identify periods where your spreadsheet diverged from your actual exchange positions (e.g., after out-of-hours events or high-frequency intraday sessions). Figure out your average untracked delta, apply the frequency × daily move × lot value formula, and add it all up.
Put these three numbers next to the Novaex subscription cost for your tier. The math will speak for itself.
Deloitte notes that commodity trading firms that formally calculate the "cost of doing nothing" make faster decisions and report higher satisfaction with their new platforms Deloitte commodity trading digital transformation report. Build the economic case before you commit.
The Missing Line Item
The cost of spreadsheet-based commodity trading has always been there. It just hasn't had a formal line item on the budget.
By breaking this cost down into reconciliation labor, missed signals, and visibility gaps, you can finally put a real dollar amount on it. For most mid-market metals trading desks, that number easily clears the cost of a structured platform in year one.
Your next steps:
- Do the math this week. Log your reconciliation hours for five days and multiply by your loaded hourly rate. It will instantly change how your team views the "cost" of switching.
- Get a Novaex demo. Compare our real-time visibility and integrated pricing directly against your current spreadsheet—not against an abstract feature list.
- Build your own ledger. Run the three-column methodology with your own numbers. Once you see the true cost, you'll know exactly how much every delayed quarter is costing you.
Novaex platform demo request | base metals position management overview | LME hedging workflow best practices guide